. 2009 May;2(2):209-21.
doi: 10.1111/j.1752-4571.2008.00058.x. Epub 2009 Feb 2.

Mixed infections and the competitive fitness of faster-acting genetically modified viruses

Affiliations

Mixed infections and the competitive fitness of faster-acting genetically modified viruses

Mark P Zwart et al. Evol Appl. 2009 May.

Abstract

Faster-acting recombinant baculoviruses have shown potential for improved suppression of insect pests, but their ecological impact on target and nontarget hosts and naturally occurring pathogens needs to be assessed. Previous studies have focused on the fitness of recombinants at the between-hosts level. However, the population structure of the transmission stages will also be decided by within-host selection. Here we have experimentally quantified the within-host competitive fitness of a fast-acting recombinant Autographa californica multicapsid nucleopolyhedrovirus missing the endogenous egt gene (vEGTDEL), by means of direct competition in single- and serial-passage experiments with its parental virus. Quantitative real-time PCR was employed to determine the ratio of these two viruses in passaged mixtures. We found that vEGTDEL had reduced within-host fitness: per passage the ratio of wild type to vEGTDEL was on average enhanced by a factor of 1.53 (single passage) and 1.68 (serial passage). There is also frequency-dependence: the higher the frequency of vEGTDEL, the stronger the selection against it is. Additionally, the virus ratio is a predictor of time to host death and virus yield. Our results show that egt is important to within-host fitness and allow for a more complete assessment of the ecological impact of recombinant baculovirus release.

Keywords: agriculture; baculovirus; egt; experimental evolution; genetically modified organisms; host parasite interactions; population ecology.


Figures
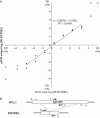
Figure 2
Figure 2
(A) qPCR calibration. On the x-axis is the log input ratio (Wt L1:vEGTDEL), the virion ratio. This is the polyhedra ratio corrected for the difference in ODV content per polyhedron between the two genotypes, by multiplication by 1.830. On the y-axis is the log transformed ratio measured by qPCR (Wt L1:vEGTDEL), for two replicate experiments. A regression line is shown, with equation and r2-value. The black diamonds were included in the regression analysis, whereas the crosses were not because the assay was not satisfactory in this range. (B) The location of the primer sets for identification of the Wt L1 and vEGTDEL viruses. PCR primers are denoted by numbered arrows: 1 and 2 are the forward and reverse primers for the Wt virus; 3 and 4 the forward and reverse primers for vEGTDEL detection. Note that although primers 3 and 4 can in principle anneal and amplify a product from the Wt L1 DNA, whether or not this template will be amplified depends on the thermal cycling program used.
Figure 1
Figure 1
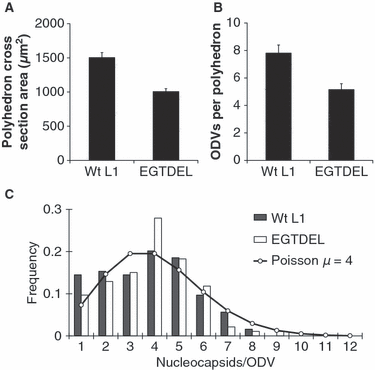
The morphology of polyhedra of the Wt L1 and vEGTDEL viruses. (A) The mean polyhedron cross section area in square micrometers, with standard error. (B) The mean number of ODV per polyhedron, with standard error. (C) The frequency distribution of nucleocapsids per ODV, and a Poisson distribution with a μ (mean) of 4 for comparative purposes.
Figure 3
Figure 3
qPCR data from 1:100 through 100:1 polyhedra inoculum mixtures. The log of the ODV ratio in the inoculum (Wt L1: vEGTDEL) on the x-axis. The log ratio Wt L1: vEGTDEL measured in individual larvae by qPCR is on the y-axis, which extends to ±infinity at log ±3. Circles are measurements in individual larvae (n = 14 per treatment). The number of data points at ±infinity is denoted by the numbers to the left of the point. The dotted line denotes a 1:1 relationship between inoculum and qPCR ratio measured. The solid line is the regression line from the GLM.
Figure 4
Figure 4
Relationship of virus genotype ratio and other infection parameters. On the x-axis is the log virus ratio (Wt L1:EGTDEL), for all panels. On the y-axis is (A) time to death in hours (B) larval cadaver weight in grams (C) polyhedra yield and (D) polyhedra yield per unit cadaver weight. Note that although a linear regression line is plotted for convenience, the data were analysed with the Jonckheere-Terpstra test.
Figure 5
Figure 5
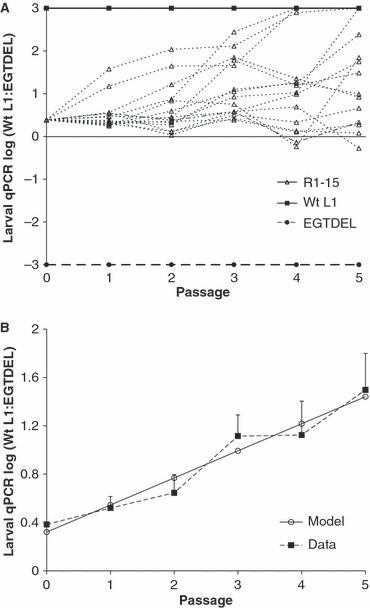
(A) qPCR data of the serial-passage experiments in individual larvae. (B) Model fitting of the mean log ratio of individual larvae, with standard error denoted by bars, and the model estimate (see equation 2).
Figure 6
Figure 6
The combined effects of differences in yield and within-host fitness, fitted to the model proposed by De Wit (1960). (A) On the x-axis is the proportion Wt virus in the inoculum; on the y-axis the polyhedra yield. The individual data points are the mean yield for each virus and the total yield, with error bars denoting the standard error of the mean. The dotted lines are the fitted model (see equation 3) for yield of each virus. The solid line is total yield as predicted by the model, which is the sum of the yields for two viruses. (B) Model fitting results: independent experimental data and model predictions for single genotype infection yield (mi experimental and model), model estimates for the crowding co-efficient ki, and r2-values obtained from the nonlinear regression.
Figure 7
Figure 7
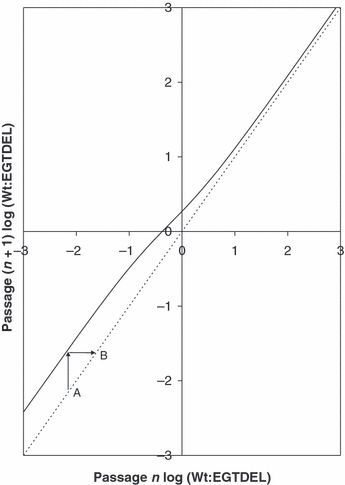
On the x-axis is the log genotype ratio (Wt L1:EGTDEL) at passage n and on the y-axis the log genotype ratio in the virus progeny after one passage of infection (n + 1). The dotted line (1:1) indicates no fitness differences ‘1:1 ratio passage n:(n + 1)’. The solid black line is the prediction from the ‘de Wit’ competition model for the change in log genotype ratio over a single passage of infection. Note that this analysis takes into account differences due to within-host competition and total yield generated. As this line lies above the 1:1 line at all ratios, the Wt virus continually has a selective advantage. For example, if the genotype ratio is Point A, within one passage it will be displaced to Point B, as read along the x-axis. Note the frequency-dependence: the lower the ratio Wt L1:EGTDEL, the stronger selection for the Wild-type virus is.

References

    1. Ben-Ami F, Mouto L, Ebert D. The effect of multiple infections in the expression and evolution of virulence in a Daphnia-endoparasite system. Evolution. 2008;62:1700–1711. - PubMed
    1. Bonsall MB, O'Reilly DR, Cory JS, Hails RS. Persistence and coexistence of engineered nucleopolyhedroviruses. Theoretical Population Biology. 2005;67:217–230. - PubMed
    1. Bull JC, Godfray HCJ, O'Reilly DR. Persistence of an occlusion-negative recombinant nucleopolyhedrovirus in Trichoplusia ni indicates high multiplicity of cellular infection. Applied and Environmental Microbiology. 2001;67:5204–5209. - PMC - PubMed
    1. Burden JP, Hails RS, Windass JD, Suner MM, Cory JS. Pathogenicity, virulence and productivity of a baculovirus expressing the itch mite toxin Txp-1 in second and fourth instar Trichoplusia ni. Journal of Invertebrate Pathology. 2000;75:226–236. - PubMed
    1. Christou P, Capell T, Kohli A, Gatehouse JA, Gatehouse AMR. Recent developments and future prospects in insect pest control in transgenic crops. Trends in Plant Science. 2006;11:302–308. - PubMed

LinkOut - more resources