. 2009 Nov;2(4):504-22.
doi: 10.1111/j.1752-4571.2009.00082.x. Epub 2009 Jul 3.

Linkage disequilibrium and population structure in wild and domesticated populations of Phaseolus vulgaris L

Affiliations

Linkage disequilibrium and population structure in wild and domesticated populations of Phaseolus vulgaris L

Monica Rossi et al. Evol Appl. 2009 Nov.

Abstract

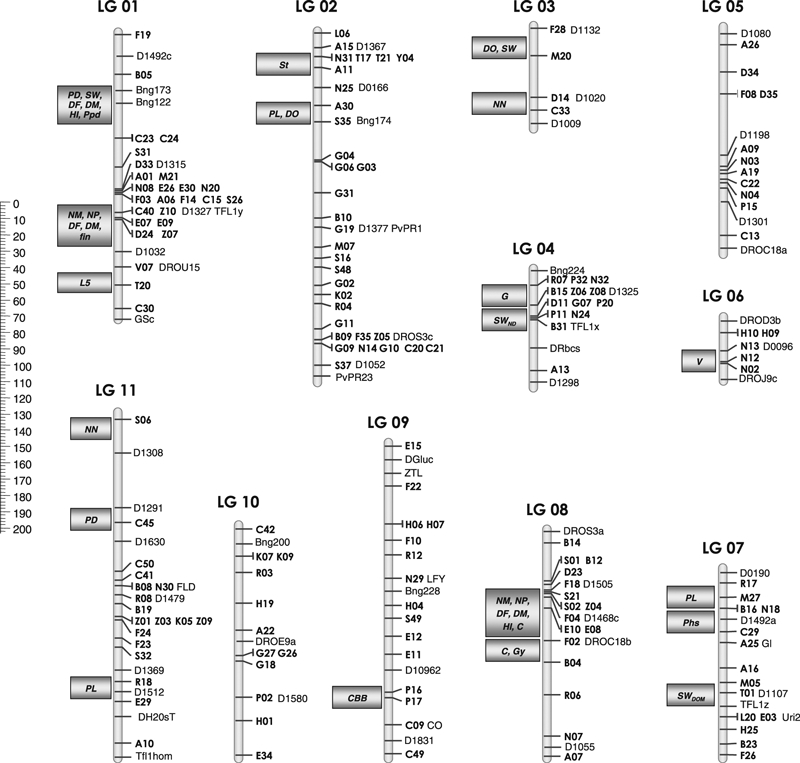
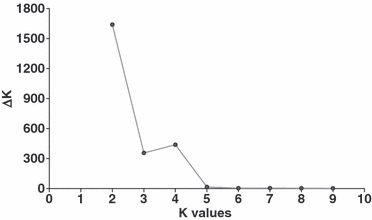
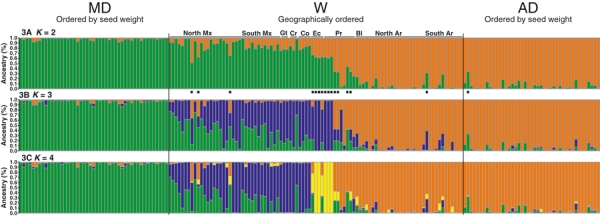
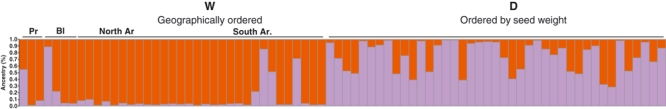
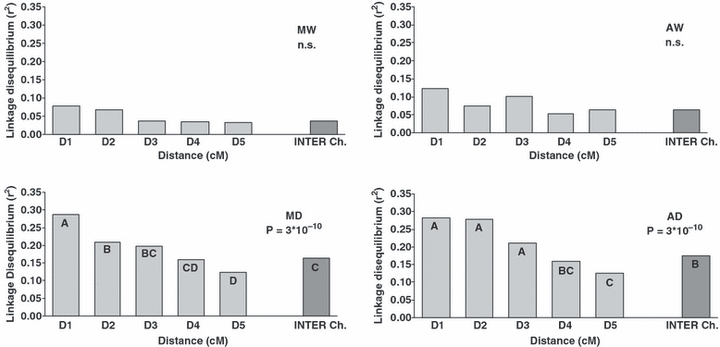
Together with the knowledge of the population structure, a critical aspect for the planning of association and/or population genomics studies is the level of linkage disequilibrium (LD) that characterizes the species and the population used for such an analysis. We have analyzed the population structure and LD in wild and domesticated populations of Phaseolus vulgaris L. using amplified fragment length polymorphism markers, most of which were genetically mapped in two recombinant inbred populations. Our results reflect the previous knowledge of the occurrence of two major wild gene pools of P. vulgaris, from which two independent domestication events originated, one in the Andes and one in Mesoamerica. The high level of LD in the whole sample was mostly due to the gene pool structure, with a much higher LD in domesticated compared to wild populations. In relation to association studies, our results also suggest that whole-genome-scan approaches are feasible in the common bean. Interestingly, an excess of inter-chromosomal LD was found in the domesticated populations, which suggests an important role for epistatic selection during domestication. Moreover, our results indicate the occurrence of a strong bottleneck in the Andean wild population before domestication, suggesting a Mesoamerican origin of P. vulgaris. Finally, our data support the occurrence of a single domestication event in Mesoamerica, and the same scenario in the Andes.

Keywords: AFLP; Common Bean; Crop Evolution; Domestication; Epistatic Selection; Leguminosae.


Figures

Figure 1
Figure 1
AFLP consensus map. Linkage groups (LG 01–LG 11) with AFLP markers (in bold) shown to the right, along with the previously mapped framework markers (Vallejos et al. 1992; Gepts et al. 1993; Nodari et al. 1993;Koinange et al. 1996; Freyre et al. 1998; Kwak et al. 2008). Domestication and other traits are shown to the left (grey rectangles), mapping them near to the AFLP markers. Genetic distances are in Kosambi map units. QTLs and major genes: CBB, common bacterial blight resistance; DF, days to flowering; DM, days to maturity; DO, dormancy; fin, determinacy; C, Gy, V seed coat pattern and colour; PD, photoperiod sensitivity; HI, harvest index; L5, length of fifth internode; NM, number of nodes on main stem; NN, rhizobium nodulation; NP, number of pods; PL, pod length; Ppd, photoperiod sensitivity; SWDOM seed weight, identified in cross with wild bean; SWND seed weight, identified in cross between cultivars (Nodari et al. 1993; Koinange et al. 1996; Gepts et al. 1999; Geffroy et al. 2000).
Figure 2
Figure 2
Distribution of ΔK-values according to K-values.
Figure 3
Figure 3
Population structure as inferred by structure v2.1; each individual is represented by a vertical line, partitioned into K coloured segments that represent the estimated membership of each individual. Black square indicates admixed genotypes at K = 2. Groups: MD, Mesoamerican domesticated; AD, Andean domesticated; W, Wild. Countries are abbreviated as follow: Ar, Argentina; Bl, Bolivia; Co, Colombia; Cr, Costa Rica; Ec, Ecuador; Gt, Guatemala; Mx, Mexico; Pr, Peru.
Figure 4
Figure 4
Independent cluster analysis for the Andean group identified at K = 2. Each individual is represented by a vertical line, partitioned into K coloured segments that represent the estimated membership for each individual. Groups: W, wild; D, domesticated. Countries are abbreviated as follow: Ar, Argentina; Bl, Bolivia; Pr, Peru.
Figure 5
Figure 5
Independent cluster analyses within forms (wild and domesticated). Each individual is represented by a vertical line, partitioned into K coloured segments that represent the estimated membership for each individual. (*) weedy genotypes. Subgroups: MW, Mesoamerican wild; MD, Mesoamerican domesticated; AW, Andean wild; AD, Andean domesticated. Countries are abbreviated as follow: Ar, Argentina; Bl, Bolivia; Co, Colombia; Cr, Costa Rica; Gt, Guatemala; Mx, Mexico; Pr, Peru.
Figure 6
Figure 6
Analysis of LD (r2 plots) as a function of genetic distance (cM) for subgroups (MW, AW, MD and AD). Intra-chromosomal classes of distances (D1: ≤3; D2: >3 and ≤10; D3: >10 and ≤30; D4: >30 and ≤50; D5: >50), inter-chromosomal class of distance (Inter Ch.); different letters on the bar plots indicate differences among the recombination distance class; n.s., not significant.

References

    1. Agapow PM, Burt A. 2000. MultiLocus version 1.2 software. Analysing multi-locus population genetic data. http://www.bio.ic.ac.uk/evolve/software/multilocus/ (accessed on 12 June 2009)
    1. Akey JM, Zhang G, Zhang K, Jin L, Shriver MD. Interrogating a high-density SNP map for signatures of natural selection. Genome Research. 2002;12:1805–1814. - PMC - PubMed
    1. Althoff DM, Gitzendanner MA, Segraves KA. The utility of amplified fragment length polymorphisms in phylogenetics: a comparison of homology within and between genomes. Systematic Biology. 2007;56:477–484. - PubMed
    1. Alvarez MT, Sanchez De Miera LE, Perez De La Vega M. Genetic variation in common and runner beans of the northern Meseta in Spain. Genetic Resources and Crop Evolution. 1998;45:243–251.
    1. Angioi SA, Desiderio F, Rau D, Bitocchi E, Attene G, Papa R. Development and use of chloroplast microsatellites in Phaseolus spp. and other legumes. Plant Biology. 2009;11:598–612. - PubMed