

Early detection of population declines: high power of genetic monitoring using effective population size estimators
- PMID: 25567959
- PMCID: PMC3352520
- DOI: 10.1111/j.1752-4571.2010.00150.x
Early detection of population declines: high power of genetic monitoring using effective population size estimators
Abstract
Early detection of population declines is essential to prevent extinctions and to ensure sustainable harvest. We evaluated the performance of two N e estimators to detect population declines: the two-sample temporal method and a one-sample method based on linkage disequilibrium (LD). We used simulated data representing a wide range of population sizes, sample sizes and number of loci. Both methods usually detect a population decline only one generation after it occurs if N e drops to less than approximately 100, and 40 microsatellite loci and 50 individuals are sampled. However, the LD method often out performed the temporal method by allowing earlier detection of less severe population declines (N e approximately 200). Power for early detection increased more rapidly with the number of individuals sampled than with the number of loci genotyped, primarily for the LD method. The number of samples available is therefore an important criterion when choosing between the LD and temporal methods. We provide guidelines regarding design of studies targeted at monitoring for population declines. We also report that 40 single nucleotide polymorphism (SNP) markers give slightly lower precision than 10 microsatellite markers. Our results suggest that conservation management and monitoring strategies can reliably use genetic based methods for early detection of population declines.
Keywords: bottleneck; computational simulations; effective population size; endangered species; habitat fragmentation; population monitoring; statistical power.
Figures
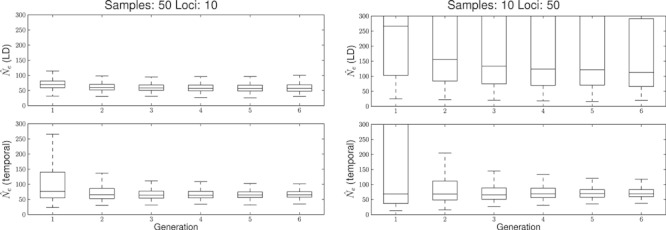
 during the first five generations of a bottleneck from N1 = 300 to N2 = 50. The left column depicts a sample size of 50 and 10 loci and the right column 10 individuals and 50 loci. Top row is the linkage disequilibrium (LD) method and bottom row, the temporal method.
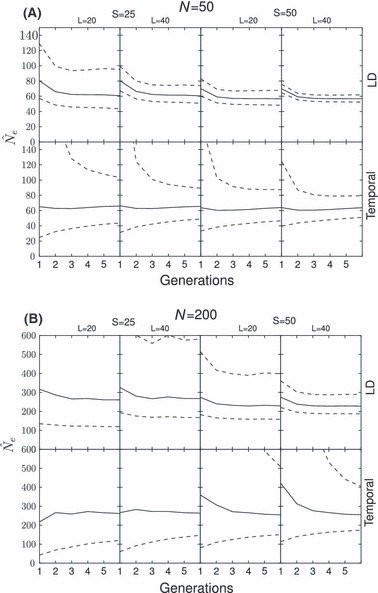
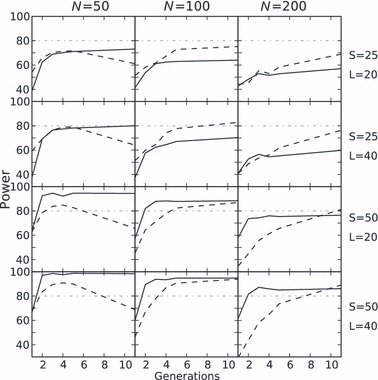
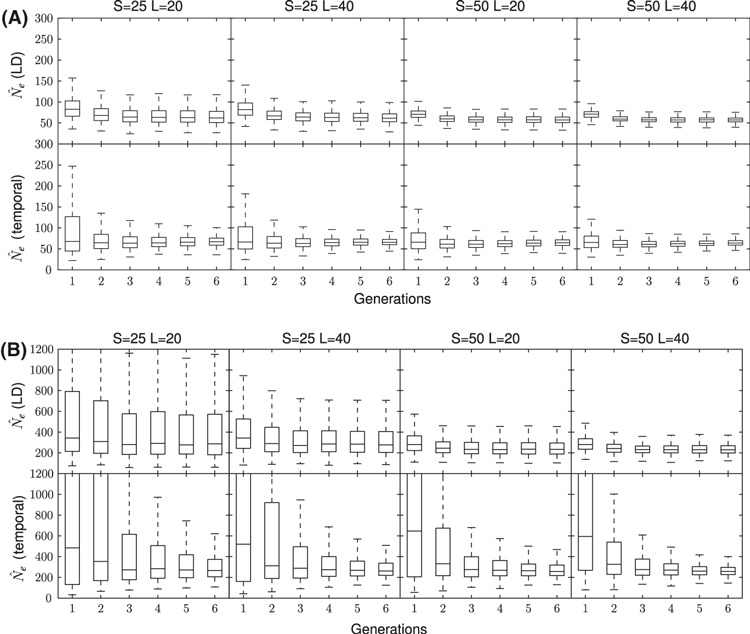
 (solid line) and 95% confidence intervals of 1200 postbottleneck replicates (dashed lines) for both methods for two bottleneck scenarios and four sampling strategies all with N1 = 600. The first chart reports a N2 = 50 and the second a N2 = 100. Different sampling strategies are shown on each panel from left to right: 25 individuals and 20 loci on the first, increasing to 40 on the second; the third shows 50 individuals and 20 loci increasing to 40 loci on the far right.
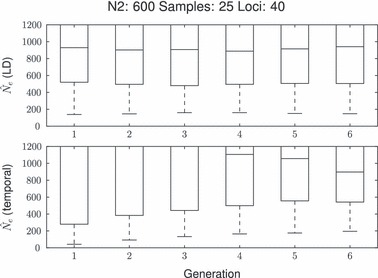
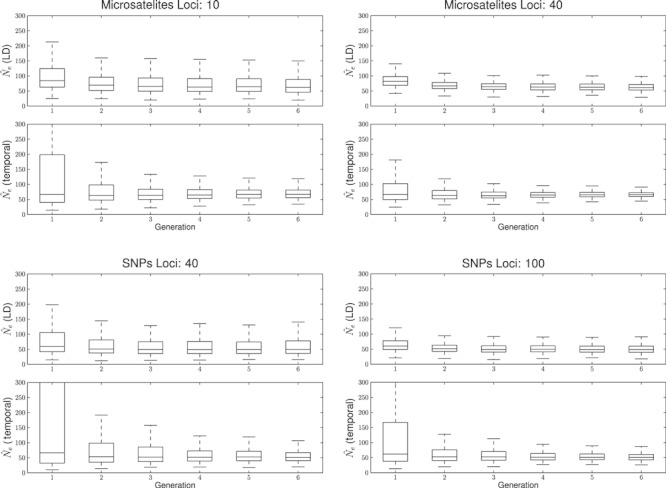
 of both estimators during the first five generations of a bottleneck from 600 to 50 with a fixed sample size of 25. The top row depicts single nucleotide polymorphisms (SNPs), left 40 loci and right 100 loci. The bottom row depicts microsatellites, left 10 loci and right 40 loci.
References
-
- Charlesworth B. Fundamental concepts in genetics: effective population size and patterns of molecular evolution and variation. Nature Reviews Genetics. 2009;10:195–205. - PubMed
-
- Crow JF, Kimura M. Introduction to Population Genetics Theory. New York: Harper & Row Publishers; 1970.
-
- Ellegren H. Microsatellites: simple sequences with complex evolution. Nature Reviews Genetics. 2004;5:435–445. - PubMed
LinkOut - more resources
Full Text Sources
Research Materials
