. 2015 Jan 7;35(1):21-35.
doi: 10.1523/JNEUROSCI.1468-14.2015.

Brg1-dependent chromatin remodelling is not essentially required during oligodendroglial differentiation

Affiliations

Brg1-dependent chromatin remodelling is not essentially required during oligodendroglial differentiation

Melanie Bischof et al. J Neurosci. .

Abstract

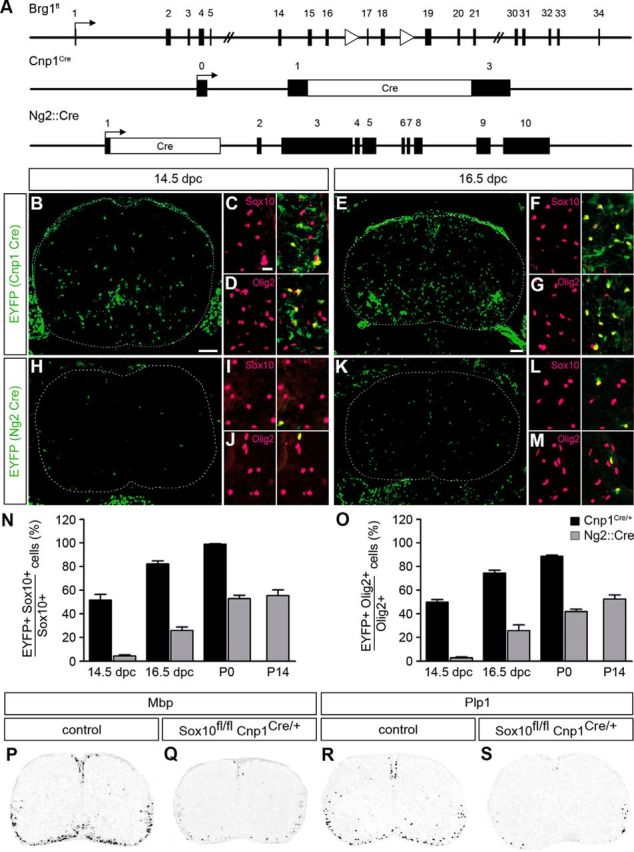
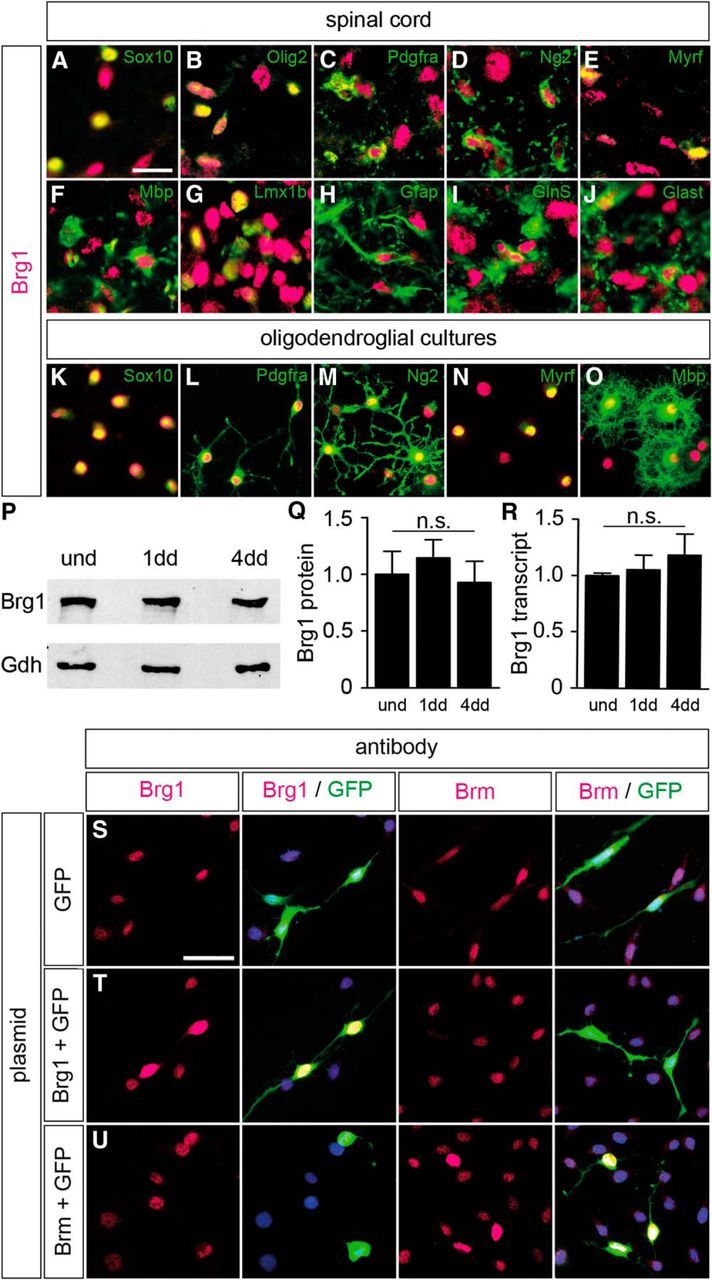
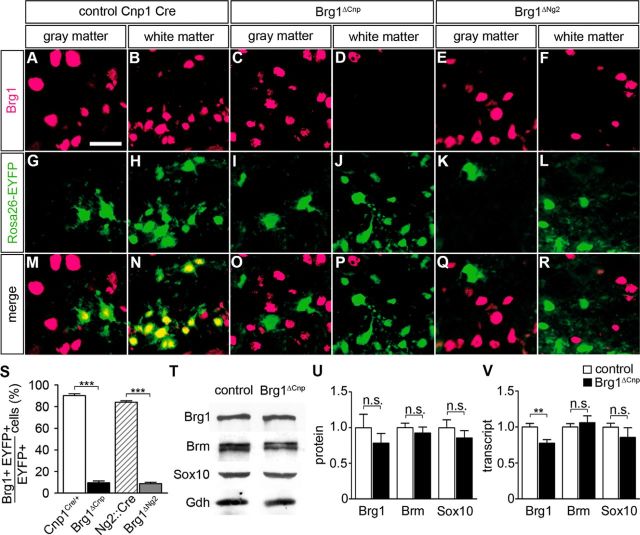
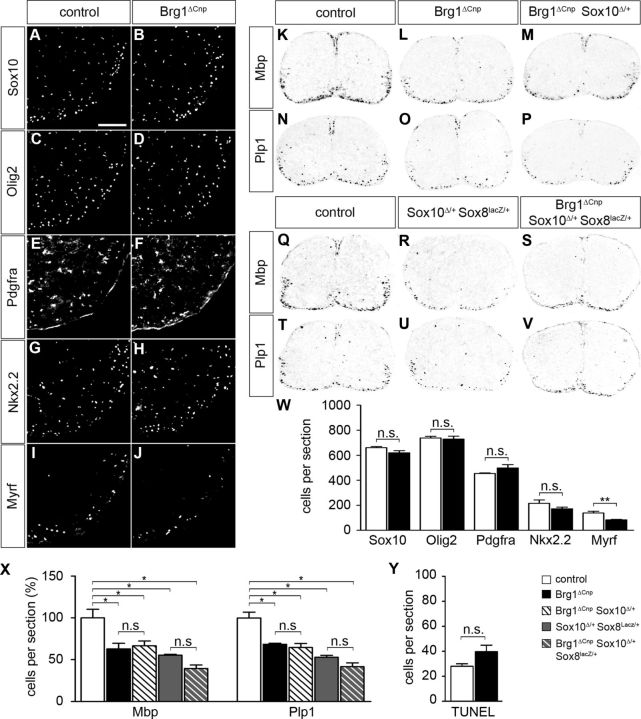
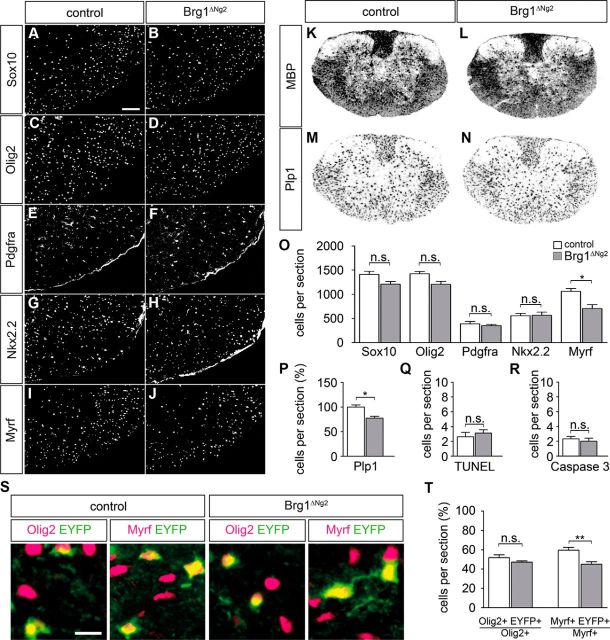
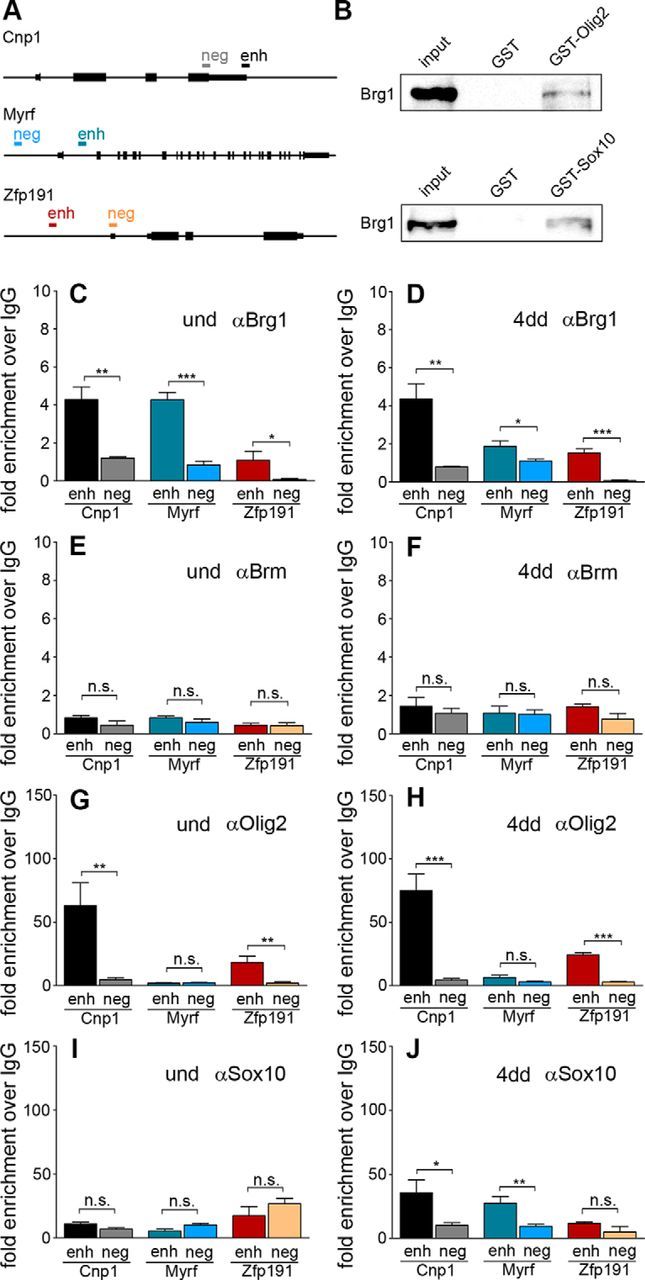
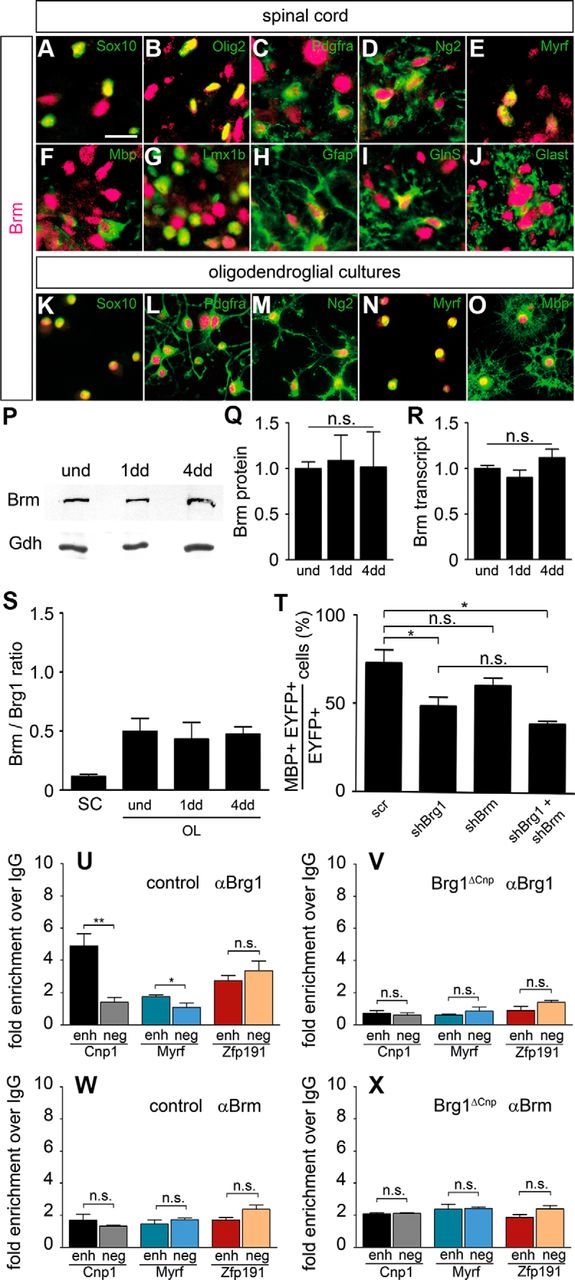
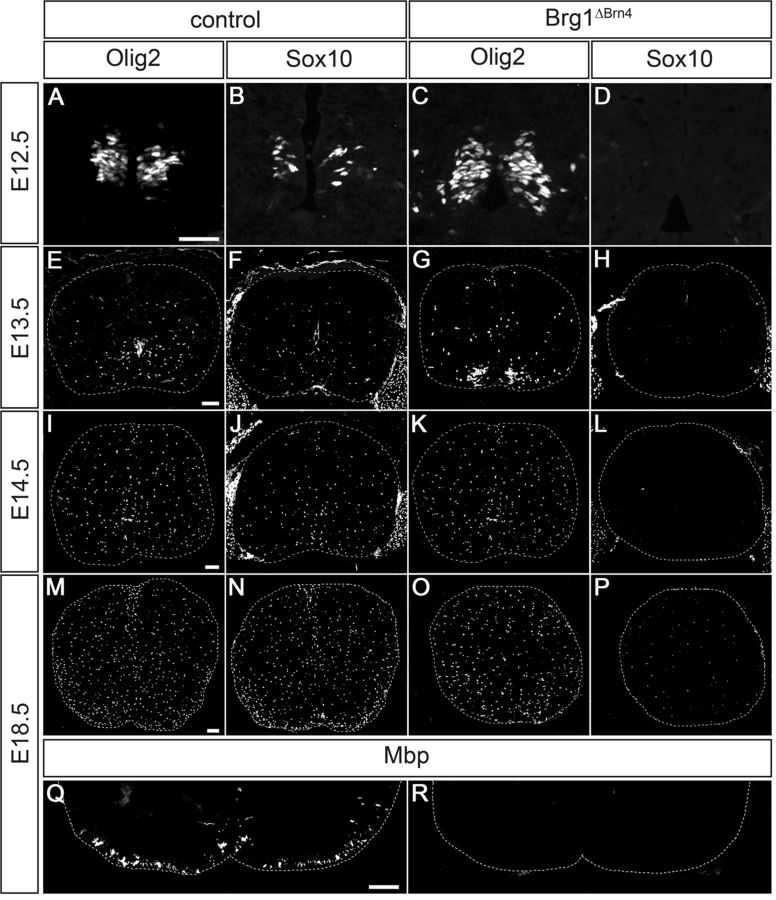
Myelinating Schwann cells in the vertebrate peripheral nervous system rely on Brg1 (Smarca4) for terminal differentiation. Brg1 serves as central ATP-hydrolyzing subunit of the chromatin remodelling BAF complexes and is recruited during myelination as part of these complexes by the transcription factor Sox10 in Schwann cells. Here, we analyzed the role of Brg1 during development of myelinating oligodendrocytes in the CNS of the mouse. Following Brg1 deletion in oligodendrocyte precursors, these cells showed normal survival, proliferation, and migration. A mild but significant reduction in the number of oligodendrocytes with myelin gene expression in the absence of Brg1 points to a contribution to oligodendroglial differentiation but also shows that the role of Brg1 is much less prominent than during Schwann cell differentiation. Additionally, we failed to obtain evidence for a genetic interaction between Brg1 and Sox10 comparable with the one in Schwann cells. This argues that similarities exist between the regulatory networks and mechanisms in both types of myelinating glia but that the exact mode of action and the relevance of functional interactions differ, pointing to a surprising degree of variability in the control of myelination.

Keywords: Schwann cell; Sox; chromatin; myelination; oligodendrocyte; transcription.


Figures

Figure 1.
Figure 1.
In vivo gene deletion strategy. A, Schematically represented are the floxed Brg1 allele (Brg1fl) and the Cre alleles (Cnp1Cre and Ng2::Cre) used for the study. Exons are numbered. Arrows indicate transcription start sites. Triangles represent loxP sites. The Cre reading frame is in white. B–M, Using the Rosa26stopfloxEYFP reporter, timing and specificity of deletion were determined for the Cnp1Cre and Ng2::Cre alleles by IHC on transverse spinal cord sections (forelimb level) at 14.5 dpc and 16.5 dpc. Cre-induced EYFP expression was detected by an antibody against GFP (green), cells of the oligodendrocyte lineage by antibodies against Sox10 (C, F, I, L), and Olig2 (D, G, J, M) (magenta). C, D, F, G, I, J, L, M, Magnifications. B, E, H, K, Overviews. The stippled line indicates the spinal cord perimeter. Scale bars: B, E, H, K, 100 μm; C, D, F, G, I, J, L, M, 25 μm. N, O, From these and comparable stainings, deletion rates at the Rosa26 locus in cells of the oligodendrocyte lineage (identified by Sox10 staining in N and by Olig2 staining in O) were quantified for the Cnp1Cre (black bars) and Ng2::Cre (gray bars) alleles at 14.5 dpc, 16.5 dpc, P0, and P14. At least nine separate sections from the forelimb region of three independent specimens were counted for each age and genotype. Data are mean ± SEM for biological replicates. No EYFP-positive cells were detected in the absence of Cre alleles. P–S, ISH was performed with probes for Mbp (P, Q) and Plp1 (R, S) on spinal cord sections (forelimb level) of Sox10fl/fl CnpCre/+ embryos and control (Sox10fl/fl Cnp1+/+) littermates at P0 to show that the Cnp1-driven Cre recombinase is sufficiently active early enough to prevent Sox10 from inducing myelin gene expression. Spinal cords were placed on a white background.
Figure 2.
Figure 2.
Brg1 expression in the oligodendrocyte lineage. A–J, Co-IHC was performed on spinal cord sections (forelimb level) at P0 to determine the occurrence of Brg1 (magenta) in cells of the oligodendrocyte lineage (Sox10 in A, Olig2 in B, Pdgfra in C, Ng2 in D, Myrf in E, and Mbp in F), in neurons (Lmx1b in G), and in astrocytes (Gfap in H, GlnS in I, and Glast in J) (all in green). Pictures were taken from either gray (G, I, J) or white matter (A–F, H). Scale bar, 25 μm. K–O, Stainings with antibodies directed against Brg1 (magenta) and various oligodendroglial markers (Sox10 in K, Pdgfra in L, Ng2 in M, Myrf in N, and Mbp in O) (all in green) were also performed on primary oligodendroglial cultures kept under proliferating (K–M) or differentiating (N, O) conditions. Scale bar, 25 μm. P, Q, By Western blot, amounts of Brg1 protein were comparable in oligodendroglial cultures kept under proliferating conditions (und) or differentiating conditions for 1 (1dd) and 4 (4dd) days when normalized to Gapdh (Gdh) levels. P, Representative Western blot. Q, Quantification from three independent biological replicates with the amounts in proliferating cultures set to 1. R, Amounts of Brg1 transcripts did not significantly differ between oligodendroglial cultures kept under proliferating conditions or differentiating conditions for 1 and 4 d. After normalization to Rpl8, amounts in the proliferating cultures were set to 1. Experiments were repeated at least three times with material from three independent cultures for each condition, and a Student's t test was applied. n.s., Not significant. S–U, To determine antibody specificity, immunohistochemistry was performed on OLN93 cells transfected with expression plasmids for Brg1 or Brm in the presence of GFP (indicated on the right) using antibodies directed against either of the two paralogs (in magenta, indicated on top). Transfected cells were identified by GFP expression (green). Scale bar, 50 μm.
Figure 3.
Figure 3.
Efficiency of Brg1 deletion in vivo. A–R, Co-IHC was performed with antibodies directed against Brg1 (magenta) and GFP (green) on transverse spinal cord sections (forelimb level) of control embryos (Rosa26+/stopfloxEYFP Cnp1+/Cre in A, B, G, H, M, N) and their Brg1ΔCnp Rosa26+/stopfloxEYFP (C, D, I, J, O, P) and Brg1ΔNg2 Rosa26+/stopfloxEYFP (E, F, K, L, Q, R) littermates at P0. Scale bar, 25 μm. S, From these staining, Brg1 occurrence was quantified in Cre-expressing cells for the following genotypes: Rosa26+/stopfloxEYFP Cnp1+/Cre (white bar), Brg1ΔCnp Rosa26+/stopfloxEYFP (black bar), Rosa26+/stopfloxEYFP Ng2::Cre (hatched bar), and Brg1ΔNg2 Rosa26+/stopfloxEYFP (gray bar). At least nine separate sections from the forelimb region of three independent specimens were counted for each age and genotype. Data are presented as mean ± SEM for biological replicates. T, U, Amounts of Brg1, Brm, and Sox10 proteins were compared in extracts from spinal cord tissue of control and Brg1ΔCnp embryos at P0 by Western blotting. Normalization was to Gapdh (Gdh). T, Representative Western blot. U, Quantification from three independent biological replicates. V, Quantitative RT-PCR was used to determine the amounts of Brg1, Brm, and Sox10 transcripts in spinal cord tissue from control (white bars) and Brg1ΔCnp (black bars) embryos at P0. After normalization to Rpl8, amounts in the control were set to 1. Experiments were repeated three times with material from three independent spinal cord preparations for each genotype. Differences to control were statistically significant where indicated (Student's t test). n.s., Not significant. **p ≤ 0.01. ***p ≤ 0.001.
Figure 4.
Figure 4.
Perinatal consequences of Brg1 deletion in Brg1ΔCnp mice. A–J, IHC was performed on transverse spinal cord sections (forelimb region) of newborn control mice (A, C, E, G, I) and Brg1ΔCnp littermates (B, D, F, H, J) with antibodies directed against Sox10 (A, B), Olig2 (C, D), Pdgfra (E, F), Nkx2.2 (G, H), and Myrf (I, J). Ventral horn region is shown placed on a black background. Scale bar, 100 μm. K–V, Myelin gene expression was analyzed by ISH on transverse spinal cord sections (forelimb region) of newborn control (K, N, Q, T), Brg1ΔCnp (L, O), Brg1ΔCnp Sox10Δ/+ (M, P), Sox10Δ/+ Sox8lacZ/+ (R, U), and Brg1ΔCnp Sox10Δ/+ Sox8lacZ/+ (S, V) mice with antisense probes for Mbp (K–M, Q–S) and Plp1 (N–P, T–V). Spinal cords were placed on a white background. W, X, From these immunohistochemical stainings and ISH, cells were quantified that expressed the various oligodendroglial markers in control (white bars), Brg1ΔCnp (black bars), Brg1ΔCnp Sox10Δ/+ (hatched white bars), Sox10Δ/+ Sox8lacZ/+ (gray bars), and Brg1ΔCnp Sox10Δ/+ Sox8lacZ/+ (hatched gray bars) mice. Y, Additionally, cells undergoing apoptosis were identified by TUNEL and counted in control and Brg1ΔCnp mice. At least nine separate sections from the forelimb region of three independent specimens were counted for each genotype in W–Y. Data are shown in absolute (W, Y) or relative numbers (X) and are presented as mean ± SEM. Differences to control were statistically significant for Myrf, Mbp, and Plp1 as indicated (Student's t test). n.s., Not significant. *p ≤ 0.05. **p ≤ 0.01.
Figure 5.
Figure 5.
Postnatal consequences of Brg1 deletion in Brg1ΔNg2 mice. A–J, IHC was performed on transverse spinal cord sections (forelimb region) of 2-week-old control mice (A, C, E, G, I) and Brg1ΔNg2 littermates (B, D, F, H, J) with antibodies directed against Sox10 (A, B), Olig2 (C, D), Pdgfra (E, F), Nkx2.2 (G, H), and Myrf (I, J). Ventral horn region is shown placed on a black background. Scale bar, 100 μm. K–N, Myelin gene expression was analyzed on transverse spinal cord sections (forelimb region) of control (K, M), and Brg1ΔNg2 (L, N) mice at 2 weeks with antisense probes for Mbp (K, L) and Plp1 (M, N). Spinal cords were placed on a white background. O, P, Cells were quantified that expressed various oligodendroglial markers in control (white bars) and Brg1ΔNg2 (gray bars) mice. Q, R, Additionally, cells undergoing apoptosis were identified by TUNEL (Q) and activated caspase-3 staining (R), and counted in control and Brg1ΔNg2 mice. At least nine separate sections from the forelimb region of three independent specimens were counted for each genotype in O–R. Data are shown in absolute (O, Q, R) or relative numbers (P, T) and are presented as mean ± SEM. Differences to control were statistically significant for Myrf as indicated (Student's t test). n.s., Not significant. *p ≤ 0.05. S, Co-IHC was performed with antibodies directed against GFP (green) and the oligodendroglial markers Olig2 and Myrf (all magenta) on transverse spinal cord sections of 2-week-old control (Rosa26+/stopfloxEYFP Ng2::Cre) and Brg1ΔNg2 Rosa26+/stopfloxEYFP mice. Scale bar, 25 μm. T, Quantifications from these stainings revealed that the percentage of GFP-labeled among all Olig2-positive cells did not vary between control and mutant, whereas the percentage of GFP-labeled among Myrf-positive cells was reduced in Brg1ΔNg2 Rosa26+/stopfloxEYFP mice (Student's t test). n.s., Not significant. **p ≤ 0.01.
Figure 6.
Figure 6.
Relation of Brg1 and Brm with oligodendroglial transcription factors. A, The Cnp1, Myrf, and Zfp191 genes are schematically depicted as well as the position of specific enhancer (enh) and negative control (neg) regions probed in ChIP experiments. B, The conserved dimerization and high-mobility group domains of Sox10 and full-length Olig2 were fused to GST (GST-Sox10, GST-Olig2) and used in pulldown assays to precipitate Brg1 from oligodendroglial CG4 cell extracts. GST alone served as control. Brg1 in input and precipitated fractions was detected by Western blot using rabbit anti-Brg1 antibody. Results were similar with extracts from undifferentiated and 4 d differentiated CG4 cells. Shown are the ones obtained with undifferentiated cells. C–J, ChIP was performed on the Cnp1, Myrf, and Zfp191 genes with antibodies directed against Brg1 (C, D), Brm (E, F), Olig2 (G, H), Sox10 (I, J), and control IgGs (C–J) on chromatin prepared from primary oligodendrocyte cultures kept under proliferating conditions (und) or differentiated for 4 d (4dd). qPCR was then used to detect specific regions in immunoprecipitated chromatin, and relative enrichments were determined in the immunoprecipitate obtained with the specific antibody over the control IgG. Experiments were performed at least two times with each PCR in triplicate (Student's t test). n.s., Not significant. *p ≤ 0.05. **p ≤ 0.01. ***p ≤ 0.001.
Figure 7.
Figure 7.
Expression and function of Brm in the oligodendrocyte lineage. A–J, Co-IHC was performed on spinal cord sections (forelimb level) at P0 to determine the occurrence of Brm (magenta) in cells of the oligodendrocyte lineage (Sox10 in A, Olig2 in B, Pdgfra in C, Ng2 in D, Myrf in E, and Mbp in F), in neurons (Lmx1b in G), and in astrocytes (Gfap in H, GlnS in I, and Glast in J) (all in green). Pictures were taken from either gray (G, I, J) or white matter (A–F, H). Scale bar, 25 μm. K–O, Stainings with antibodies directed against Brm (magenta) and various oligodendroglial markers (Sox10 in K, Pdgfra in L, Ng2 in M, Myrf in N, and Mbp in O) (all in green) were also performed on primary oligodendroglial cultures kept under proliferating (K–M) or differentiating (N, O) conditions. Scale bar, 25 μm. P, Q, By Western blot, Brm protein amounts were comparable in oligodendroglial cultures kept under proliferating conditions (und) or differentiating conditions for 1 (1dd) and 4 (4dd) days when normalized to Gapdh (Gdh) levels. P, A representative Western blot. Q, Quantification from three independent biological replicates with protein amounts in proliferating conditions set to 1. R, Brm transcript amounts did not significantly differ between oligodendroglial cultures kept under proliferating conditions or differentiating conditions for 1 and 4 d. After normalization to Rpl8, amounts in the proliferating cultures were set to 1. Experiments were repeated at least three times with material from three independent cultures for each condition, and a Student's t test was applied. n.s., Not significant. S, Transcript amounts were determined for Brm and Brg1 by qPCR in three independent experiments in Schwann cells as well as in oligodendroglial cultures kept under proliferating or differentiating conditions. After normalization to Rpl8, amounts were used to determine a Brm to Brg1 ratio. Although this ratio bears no information about the absolute Brm and Brg1 levels in these cells, it allows to conclude that oligodendrocytes contain more Brm relative to Brg1 than Schwann cells. T, Mbp expression was determined by immunocytochemistry on primary OPCs transfected with scrambled (scr), Brg1-specific (shBrg1), and Brm-specific (shBrm) shRNA or combinations thereof. A total of 100 cells were counted for each transfection in three separate experiments. The percentage of Mbp-expressing cells among all transfectants was then determined in three independent experiments (Student's t test). ns, Not significant. *p ≤ 0.05. U–X, ChIP was performed on the Cnp1, Myrf, and Zfp191 genes with antibodies directed against Brg1 (U, V), Brm (W, X), and control IgGs (U–X) on chromatin prepared from brains of wild-type and Brg1ΔCnp mice at P0. qPCR was then used to detect specific regions in immunoprecipitated chromatin, and relative enrichments were determined in the immunoprecipitate obtained with the specific antibody over the control IgG. Experiments were performed three times with each PCR in triplicate (Student's t test). n.s., Not significant. *p ≤ 0.05. **p ≤ 0.01.
Figure 8.
Figure 8.
Consequences of Brg1 deletion in Brg1ΔBrn4 mice. IHC was performed on transverse spinal cord sections (forelimb region) of control mice (A, B, E, F, I, J, M, N, Q) and Brg1ΔBrn4 littermates (C, D, G, H, K, L, O, P, R) at 12.5 dpc (A–D), 13.5 dpc (E–H), 14.5 dpc (I–L), and 18.5 dpc (M–R) with antibodies directed against Olig2 (A, C, E, G, I, K, M, O), Sox10 (B, D, F, H, J, L, N, P), and Mbp (Q, R). Sox10 and Mbp expression is strongly reduced in Brg1ΔBrn4 mice. M–P, Spinal cords were placed on a black background. Scale bar (each valid for the whole row): A, 50 μm; E, I, M, Q, 100 μm.

Similar articles

Cited by

References

    1. Ahn K, Mishina Y, Hanks MC, Behringer RR, Crenshaw EB., 3rd BMPR-IA signaling is required for the formation of the apical ectodermal ridge and dorsal-ventral patterning of the limb. Development. 2001;128:4449–4461. - PubMed
    1. Britsch S, Goerich DE, Riethmacher D, Peirano RI, Rossner M, Nave KA, Birchmeier C, Wegner M. The transcription factor Sox10 is a key regulator of peripheral glial development. Genes Dev. 2001;15:66–78. doi: 10.1101/gad.186601. - DOI - PMC - PubMed
    1. Cunliffe VT, Casaccia-Bonnefil P. Histone deacetylase 1 is essential for oligodendrocyte specification in the zebrafish CNS. Mech Dev. 2006;123:24–30. doi: 10.1016/j.mod.2005.10.005. - DOI - PubMed
    1. Emery B. Transcriptional and post-transcriptional control of CNS myelination. Curr Opin Neurobiol. 2010;20:601–607. doi: 10.1016/j.conb.2010.05.005. - DOI - PubMed
    1. Finzsch M, Stolt CC, Lommes P, Wegner M. Sox9 and Sox10 influence survival and migration of oligodendrocyte precursors in the spinal cord by regulating PDGF receptor α expression. Development. 2008;135:637–646. doi: 10.1242/dev.010454. - DOI - PubMed

Publication types

LinkOut - more resources