. 2015 Jan 7;35(1):267-86.
doi: 10.1523/JNEUROSCI.2310-14.2015.

Early-course unmedicated schizophrenia patients exhibit elevated prefrontal connectivity associated with longitudinal change

Affiliations

Early-course unmedicated schizophrenia patients exhibit elevated prefrontal connectivity associated with longitudinal change

Alan Anticevic et al. J Neurosci. .

Abstract

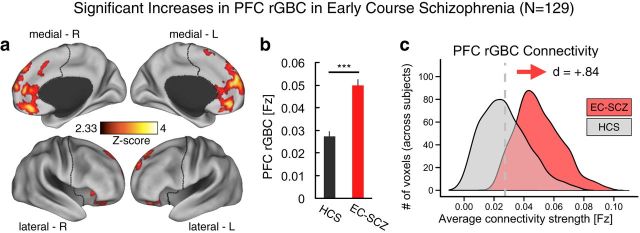
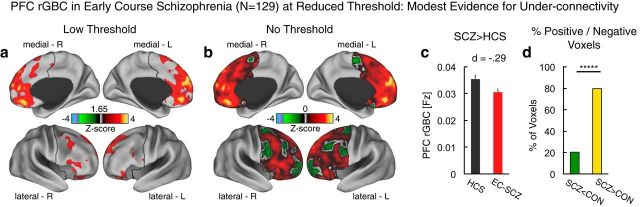
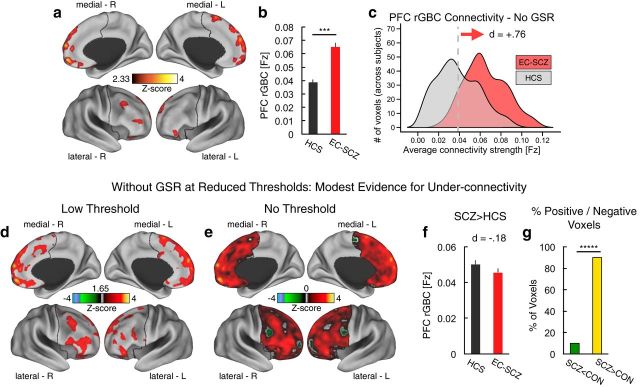
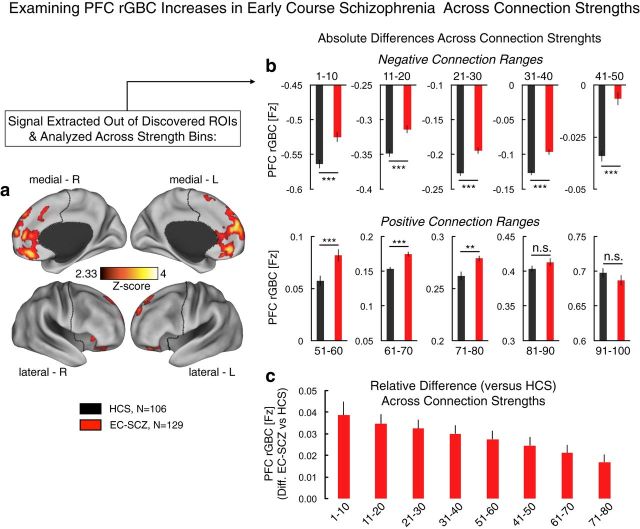
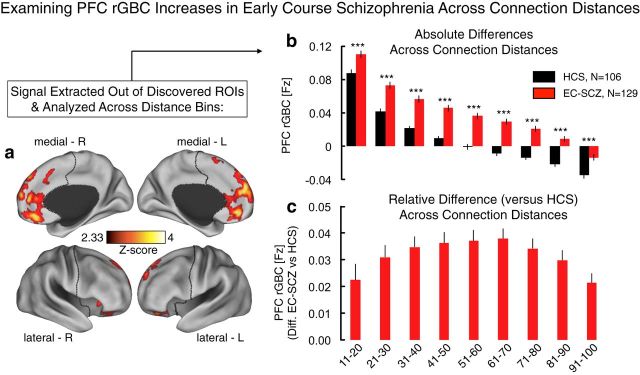
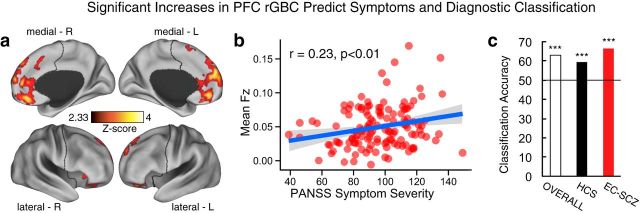
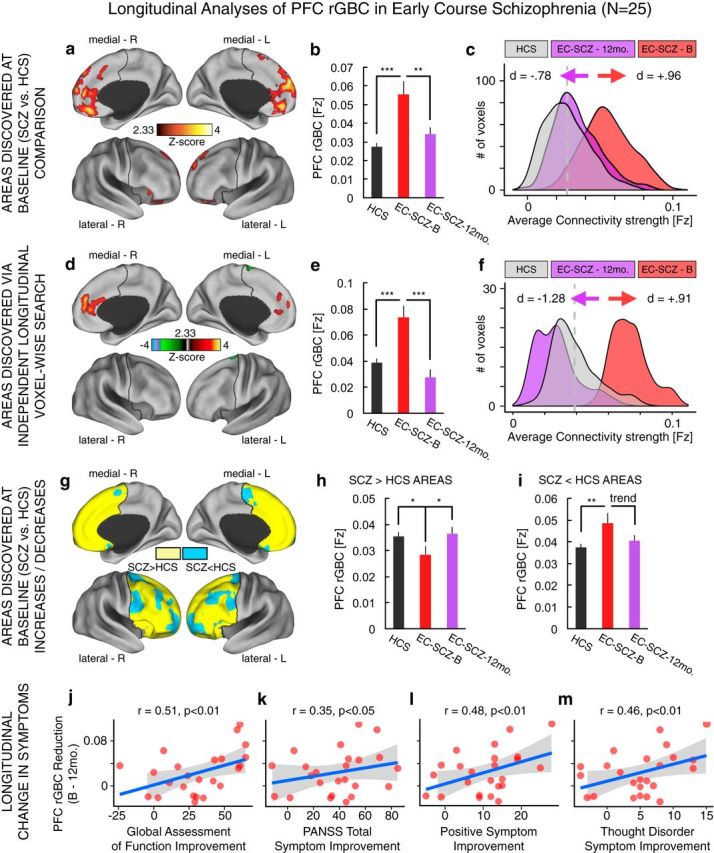
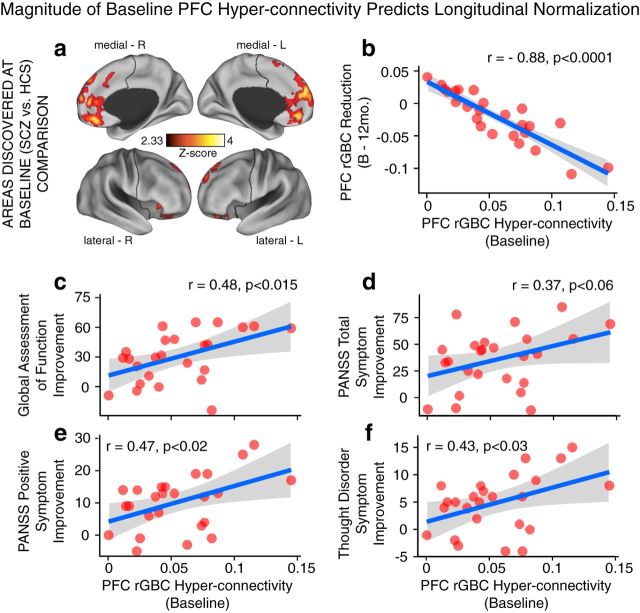
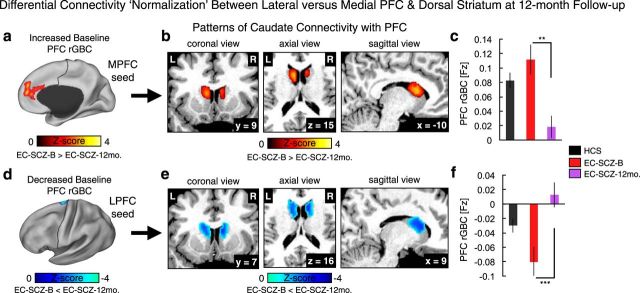
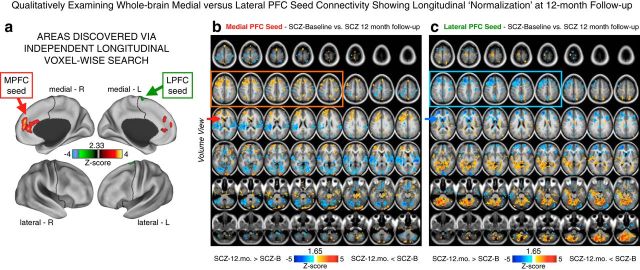
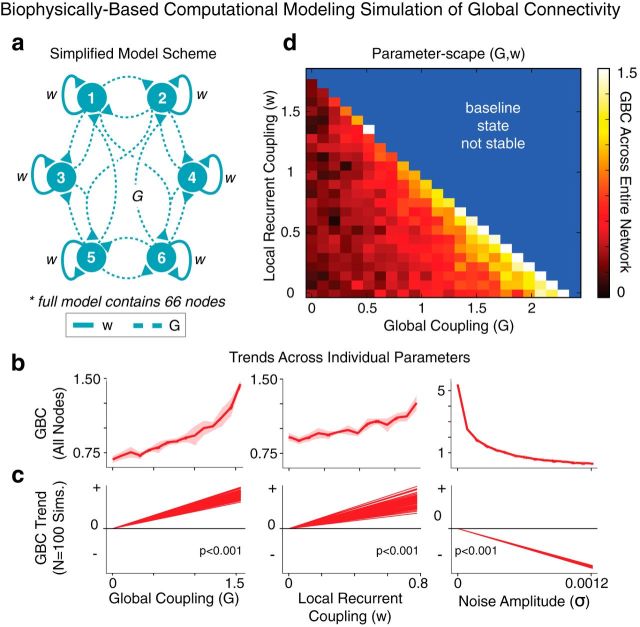
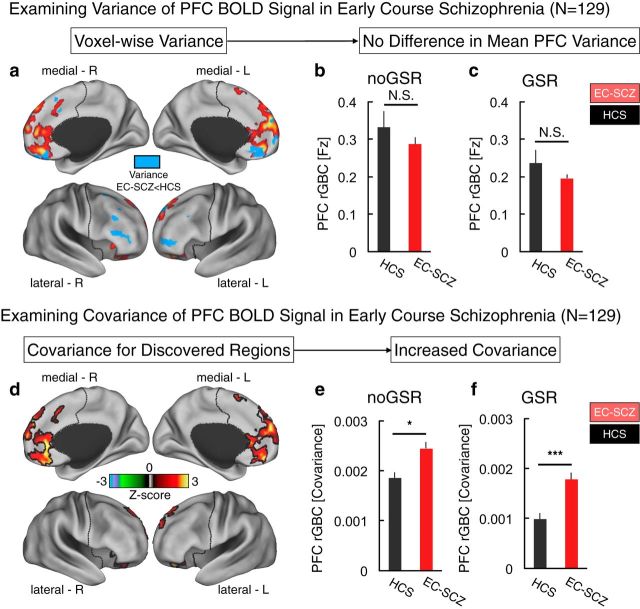
Strong evidence implicates prefrontal cortex (PFC) as a major source of functional impairment in severe mental illness such as schizophrenia. Numerous schizophrenia studies report deficits in PFC structure, activation, and functional connectivity in patients with chronic illness, suggesting that deficient PFC functional connectivity occurs in this disorder. However, the PFC functional connectivity patterns during illness onset and its longitudinal progression remain uncharacterized. Emerging evidence suggests that early-course schizophrenia involves increased PFC glutamate, which might elevate PFC functional connectivity. To test this hypothesis, we examined 129 non-medicated, human subjects diagnosed with early-course schizophrenia and 106 matched healthy human subjects using both whole-brain data-driven and hypothesis-driven PFC analyses of resting-state fMRI. We identified increased PFC connectivity in early-course patients, predictive of symptoms and diagnostic classification, but less evidence for "hypoconnectivity." At the whole-brain level, we observed "hyperconnectivity" around areas centered on the default system, with modest overlap with PFC-specific effects. The PFC hyperconnectivity normalized for a subset of the sample followed longitudinally (n = 25), which also predicted immediate symptom improvement. Biologically informed computational modeling implicates altered overall connection strength in schizophrenia. The initial hyperconnectivity, which may decrease longitudinally, could have prognostic and therapeutic implications.

Keywords: computational modeling; first episode; hyperconnectivity; longitudinal; prefrontal cortex; schizophrenia.


Figures

Figure 1.
Figure 1.
PFC connectivity is increased in EC-SCZ. a, Clusters mark regions surviving an independent samples t test comparing patients with schizophrenia early in their illness course (EC-SCZ, N = 129) with HCS (N = 106). b, c, Signal was extracted from all clusters showing a significant effect in a to characterize the magnitude and distribution of the main effect. Effects indicate a highly robust increase in PFC rGBC for EC-SCZ relative to HCS, verified via formal effect sizes computed across subjects (Cohen's d = 0.84). Gray vertical dashed line in c marks the mean for the HCS group. For all region coordinates and relevant statistics, see Table 2. Error bars mark ± 1 SEM. All p-values are 2-tailed. ***p < 0.001; **p < 0.01; *p < 0.05.
Figure 2.
Figure 2.
Examination of regions showing prefrontal hypoconnectivity in EC-SCZ at reduced statistical thresholds. a, At lower thresholds (Z > 1.65), there was still no evidence of hypoconnectivity in EC-SCZ patients. b, Threshold-free patterns are shown. Red-yellow areas mark regions were rGBC was increased in EC-SCZ relative to HCS. Green areas mark regions were rGBC was decreased in EC-SCZ relative to HCS. These patterns highlight that there is modest evidence for hypoconnectivity. c, rGBC values are extracted out of all of the regions that show reduction in EC-SCZ (i.e., all green areas). This quantitatively verifies that the magnitude of the effect was modest (Cohen's d = −0.29). d, We quantified the proportions of voxels showing increased (yellow) versus reduced (green) rGBC in EC-SCZ relative to HCS. The overwhelming proportion of voxels (80%) showed increased rGBC in EC-SCZ (binomial proportion test, p < 0.0001). Error bars mark ± 1 SEM. All p-values are 2-tailed. ****p < 0.0001; ***p < 0.001; **p < 0.01; *p < 0.05.
Figure 3.
Figure 3.
Effects without GSR remain unchanged. a–c, Effects as in Figures 1 and 2, only without GSR applied, illustrating a consistent pattern of core clinical effects. Clusters mark regions surviving an independent samples t test comparing patients with schizophrenia early in their illness course (EC-SCZ, N = 129) to HCS. dg, Effects at lower thresholds also remained qualitatively unchanged without GSR (as in Fig. 2). Error bars mark ± 1 SEM. This demonstration is particularly important given recent reports that the global signal may show elevated variability in chronic SCZ patients, which could possibly affect between-group analyses in complex ways (Yang et al., 2014). All p-values are 2-tailed. ****p < 0.0001; ***p < 0.001; **p < 0.01; *p < 0.05.
Figure 4.
Figure 4.
Comparing PFC and whole-brain (WB) GBC results. The principal findings revealed robustly increased PFC rGBC in EC-SCZ, but little evidence for PFC hypoconnectivity. It remains unknown whether areas identified within the PFC are indeed specific to the restricted analysis or instead represent a more general feature when the analyses are extended to all voxels (i.e., whole-brain GBC). To test this question, we directly juxtaposed threshold-free cluster enhancement (TFCE; Smith and Nichols, 2009) corrected volume and surface maps of group differences between EC-SCZ patients and matched HCS. a, b, Results are shown for the PFC analysis (as in Fig. 1). Here, red foci mark regions where SCZ showed statistically higher PFC rGBC than HCS. c, d, Results are shown for the WB GBC analysis. Red foci mark regions where patients showed statistically higher WB GBC than HCS, whereas blue foci show regions where patients show statistically lower WB GBC than HCS. Results indicated both increased and decreased WB GBC when extending analyses across all voxels; however, the clusters evident for the PFC analyses were not present to the same extent for the WB analyses. ef, To highlight the relatively small degree of overlap between the analyses, we computed a conjunction between the WB (orange areas) and the PFC effects (yellow areas); overlap is shown in red. g, h, Results are shown for the WB GBC analysis at a lower statistical threshold. Red foci mark regions where patients showed statistically higher WB GBC than HCS, whereas blue foci show regions where patients show statistically lower WB GBC than HCS. The clusters evident for the PFC analyses were not present to the same extent even for these lower threshold analyses. Top panels show the results in a volume representation, whereas bottom panels show the same data mapped onto a surface representation.
Figure 5.
Figure 5.
Examining strength of connection contribution to the PFC rGBC effect. a, We examined whether the PFC rGBC effect in EC-SCZ is driven by a particular connection strength range or if it is generally prevalent across connection strengths. We did so by extracting the signal out of regions showing hyperconnectivity in EC-SCZ versus HCS (as in Fig. 1a). b, Averaging across all of the regions identified in the original analysis, we quantified the contribution to the effect across strength connection bins, separated into deciles (i.e., 10% increments). As with the original effect, this analysis was restricted to PFC voxels only. EC-SCZ was associated with higher PFC rGBC for both negative (top) and positive (bottom) connection ranges, although the top two bins failed to reach significance. c, We expressed values at each connection strength bin as differences from the mean of the control group at that particular bin. This analysis further indicates that the hyperconnectivity in SCZ is evident across most connection strengths, but somewhat progressively reduced at the top connection strengths (and was not significant for the top 20% of connection strengths, which are presented in a, perhaps reflecting a ceiling effect). We quantified this effect using an ANOVA with one between-group factor (Group, EC-SCZ vs HCS) and one within-group factor (Strength Range). ANOVA results revealed a significant main effect of group, confirming the general PFC hyperconnectivity in EC-SCZ (F(1,233) = 38.65, p = 2.31 × 10⁻⁹). Overall, these analyses highlight a relatively uniform increase across most of the connection strength ranges, except for the top connections, perhaps reflecting a ceiling effect. Error bars mark ± 1 SEM. All p-values are 2-tailed. ***p < 0.001; **p < 0.01; *p < 0.05.
Figure 6.
Figure 6.
Examining distance of connection contribution to the PFC rGBC effect. a, As with the strength of connection analysis above, here, we examined whether the PFC rGBC effect in EC-SCZ is driven by a particular connection distance. Put simply, perhaps only the local (or distal) voxels are impacting the effect. Alternatively, the effect may be prevalent regardless of connection distance. We quantified the Euclidian distance from each voxel to the center of mass of the regions that displayed hyperconnectivity at baseline (see Materials and Methods). b, Averaging across all of the regions identified in the original analysis in Figure 1a, we quantified the contribution to the effect across connection distances, separated into deciles (i.e., 10% increments), also restricted to PFC voxels only. As evident for each connection distance range, EC-SCZ was associated with higher PFC rGBC for both near and far connections. c, Again, we expressed values at each connection distance bin as differences from the mean of the control group at that particular bin. This analysis indicates that the hyperconnectivity in SCZ is evident across connection distances (although the effect was not sensitive to the closest connections, as those were the same voxels from which the GBC was computed). We quantified this effect using an ANOVA with one between-group factor (Group, EC-SCZ vs HCS) and one within-group factor (Connection Distance). ANOVA results revealed a main effect of group, confirming the hyperconnectivity in SCZ (F(1,233) = 44.35, p = 1.95 × 10⁻¹⁰). These analyses further support the hypothesis that hyperconnectivity is present across PFC connections across distances. Error bars mark ± 1 SEM. All p-values are 2-tailed. ***p < 0.001; **p < 0.01; *p < 0.05.
Figure 7.
Figure 7.
Relationship between symptoms, diagnostic classification, and PFC rGBC. a, Effects as in Figure 1. b, Significant positive relationship between PFC rGBC across all voxels in a and overall PANSS symptom severity for EC-SCZ patients (N = 129, r = 0.23, p < 0.01). c, Classification accuracy findings showing above-chance results (horizontal line marks chance at 50%): 63% overall accuracy (p < 0.0001), 67% for EC-SCZ (p < 0.0001), and 59% for HCS (p < 0.01). PANSS, Positive and Negative Symptom Scale for SCZ (Kay et al., 1987). All p-values are 2-tailed. ***p < 0.001; **p < 0.01; *p < 0.05.
Figure 8.
Figure 8.
Longitudinal analyses of PFC rGBC in relation to symptom improvement. a, Effects as in Figure 1, indicating discovery results. b, c, When examining only voxels identified at baseline (Fig. 1), there was a significant longitudinal reduction in PFC rGBC in EC-SCZ at 12-month follow-up (EC-SCZ-12mo., N = 25, purple) relative to baseline scans (EC-SCZ-B, N = 25, red), quantified via formal effect sizes computed across subjects (Cohen's d = −0.78). df, The same pattern held when computing a PFC voxelwise search comparing patients' baseline scans with their scans at 12-month follow-up (Cohen's d = −1.28). g–i, The normalization in connectivity was evident when examining all regions where rGBC was increased in EC-SCZ relative to HCS at baseline (yellow areas) and decreased in EC-SCZ relative to HCS at baseline (blue areas; as in Fig. 2). j–m, The magnitude of PFC rGBC hyperconnectivity normalization was significantly related to symptom improvement at 12-month follow-up. The pattern was driven predominantly by a change in positive symptoms (negative symptoms did not show a significant relationship, r = 0.09, NS). Gray vertical dashed lines in distribution plots marks the mean for the HCS group. Error bars mark ± 1 SEM. PANSS, Positive and Negative Symptom Scale for SCZ (Kay et al., 1987). All p-values are 2-tailed. ***p < 0.001; **p < 0.01; *p < 0.05.
Figure 9.
Figure 9.
Magnitude of baseline PFC rGBC predicts longitudinal improvement in connectivity and symptoms. a, b, The magnitude of PFC rGBC hyperconnectivity at baseline was highly significantly related to normalization in connectivity at 12-month follow-up (r = 0.88, p < 0.0001). c–f, The same relationship held for symptom improvement at 12-month follow-up. These effects illustrated that those patients with most severe PFC hyperconnectivity were those with most improvement in connectivity and symptoms after treatment was started. PANSS, Positive and Negative Symptom Scale for SCZ (Kay et al., 1987). All p-values are 2-tailed. ***p < 0.001; **p < 0.01; *p < 0.05.
Figure 10.
Figure 10.
Longitudinal normalization of prefrontal-striatal connectivity. Using GBC analyses, we found a normalization of PFC rGBC at 12-month follow-up in two foci—left lateral PFC and medial PFC (see Fig. 8d). a, We examined connectivity between the MPFC region and the anatomically defined caudate ROI for EC-SCZ at baseline (EC-SCZ-B, N = 25, purple) versus EC-SCZ at 12-month follow-up (EC-SCZ-12mo., N = 25, purple; see Materials and Methods for details). b, Red foci show a caudate mask for which connectivity with MPFC was increased at baseline (EC-SCZ-B), but normalized at 12-month follow-up (EC-SCZ-12mo). c, Bar plot illustrating this reduction of MPFC-caudate connectivity at 12-month follow-up (t(23) = 3.6, p < 0.002; Cohen's d = 0.72). d, In turn, we examined connectivity from the LPFC region to anatomically defined caudate ROI for EC-SCZ-B versus EC-SCZ-12mo. e, Blue foci mark regions for which connectivity with LPFC was reduced at baseline (EC-SCZ-B), but normalized at 12-month follow-up (EC-SCZ-12mo). f, Bar plot illustrating this “increase” of LPFC-caudate connectivity at 12-month follow-up (t(23) = 3.82, p < 0.001; Cohen's d = −0.77). The dissociation was also verified by a significant Seed (LPFC vs MPFC) × Follow-up (Baseline vs 12-mo.) interaction (F(1,24) = 31.4, p = 9.1 × 10⁻⁶), indicating a differential pattern of connectivity normalization between lateral and medial PFC with caudate. Cohen's d values were corrected for correlation between repeated measures and reflect the effect size for the SCZ baseline versus 12-month follow-up comparison (within-subject comparison). Error bars mark ± 1 SEM. ***p < 0.001; **p < 0.01; *p < 0.05.
Figure 11.
Figure 11.
Qualitatively examining MPFC versus LPFC seeds showing longitudinal PFC rGBC normalization at 12-month follow-up. a, The two regions that exhibited longitudinal alterations in PFC rGBC when comparing patients at baseline (SCZ-B) versus the 12-month follow-up (SCZ-12.mo; same data as shown in Fig. 8d). Here, we explored the pattern of connectivity for each of the regions identified via PFC rGBC analyses—namely the LPFC (shown in green) and the MPFC (shown in red-yellow). We used these regions as seeds to compute a connectivity map for each patient at baseline and their 12-month follow-up scan. These analyses were conducted for exploratory reasons to further inform the pattern of normalization in connectivity at 12-month follow-up shown in Figure 10. b, Differences between SCZ-B and SCZ-12.mo for the MPFC seed. Red-orange foci mark regions where SCZ-B exhibited elevated MPFC connectivity relative to SCZ-12.mo, whereas blue foci mark regions where SCZ-B exhibited reduced MPFC connectivity relative to SCZ-12.mo. c, Differences between SCZ-B and SCZ-12.mo for the LPFC seed. Again, red-orange foci mark regions where SCZ-B exhibited elevated MPFC connectivity relative to SCZ-12.mo, whereas blue foci mark regions where SCZ-B exhibited reduced MPFC connectivity relative to SCZ-12.mo. Both maps are shown at a reduced threshold (p < 0.05, uncorrected) to better highlight the qualitative whole-brain dissociations in connectivity between the two seeds. For the MPFC seed, patients exhibited elevated connectivity with PFC, consistent with the main effect (orange box). However, for the LPFC seed, patients exhibited mainly reductions in connectivity with other PFC regions (blue box). The red and blue arrows in the third row highlight the dissociations in the dorsal striatum, which are presented in a focused a priori analysis based on hypothesized mechanisms of antipsychotic action (see Fig. 10). Collectively, these patterns highlight the dissociation in whole-brain patterns of normalization for the MPFC and LPFC seeds, which mirror the patterns presented specifically for the striatum.
Figure 12.
Figure 12.
Computational modeling simulation of BOLD signal illustrates a biologically grounded hypothetical mechanism for increased connectivity in schizophrenia. a, We used a biophysically based computational model of BOLD rs-fcMRI to explore parameters that could reflect elevated connectivity observations in SCZ. The two key parameters are strength of local, recurrent self-coupling (w) within nodes (solid lines) and strength of long-range, global coupling (G) between 66 nodes in total (dashed lines), adapted from prior work (Deco et al., 2013). b, Simulations indicate increased GBC, computed across all nodes, in response to increased G (left) or w (middle). The noise parameter (σ; right) provided a control, indicating a reduction in GBC as expected. Error bars represent the SD at each value of w or G computed across four simulated models with different random noise, illustrating model stability. c, The specific configuration of the structural connectivity matrix (Hagmann et al., 2008) did not affect the net pattern of the modeling results, indicating the same trends across 100 simulations with randomly repermuted structural connectivity matrices (all p < 0.001, test for binomial proportions). d, Two-dimensional parameter space capturing the positive relationship between w/G and GBC of the BOLD signal across all nodes. The blue area marks regimes where the model baseline is unstable due to elevated G and/or w. These simulations illustrate how alterations in biophysically based parameters (rather than physiological noise) can increase GBC, as observed empirically in EC-SCZ.
Figure 13.
Figure 13.
Examining PFC BOLD signal variability and PFC rGBC using non-normalized covariance. The modeling simulations revealed that the in silico derived GBC decreased as a function of increasing σ (i.e., the noise parameter, see Fig. 12b, right). This effect in particular illustrates that elevated GBC is not a generic property of any chosen parameter, but rather reflects an increase in key signal-bearing w/G parameters. However, it is possible that, in vivo, there is actually a decrease in PFC-wide variance of BOLD signals in EC-SCZ. This is particularly relevant to the modeling simulations because a decrease in BOLD signal variability in EC-SCZ relative to HCS would by definition produce an increased correlation (and would therefore result in a profile of hyperconnectivity in EC-SCZ mathematically). However, such a result would not actually reflect an aberrant increase in signal covariance, as predicted by the model. ac, We first examined whether the PFC-derived BOLD signal exhibited differences in variance structure between EC-SCZ and HCS groups. There were no between-group effects in mean PFC variance without GSR (t(235) = 1.02, p = 0.3) or after GSR (t(235) = 1.2, p = 0.23), suggesting no differences in overall PFC BOLD signal variability profiles. Moreover, when examining voxelwise effects (see map in a), the areas where the variance was mostly decreased in EC-SCZ (blue) did not overlap with areas where there was hyperconnectivity (red). This indicates that the PFC hyperconnectivity reported in Figure 1 cannot be driven exclusively by lower variance in EC-SCZ, which would by definition increase the correlation coefficient. d, Further, we computed a non-normalized covariance as an index of rGBC (as opposed to a correlation coefficient) within the discovered regions to fully establish that between-group clinical comparisons did not arise due to nonshared sources of variability (Friston, 2011). That is, the correlation coefficient normalizes the covariance between signals by using the variance of each of the signals, whereas the covariance analysis only considers the shared signal. e, f, Covariance results still indicated robust hyperconnectivity in EC-SCZ, both without GSR (t(235) = 2.3, p < 0.026; e) and after GSR (t(235) = 4.4, p < 0.00001; f). This effect is consistent with the abnormally increased GBC in silico, supporting the conclusion that hyperconnectivity effects in patients cannot be driven by a PFC BOLD signal variability reduction. Error bars mark ± 1 SEM. ***p < 0.001; **p < 0.01; *p < 0.05.

References

    1. Andreasen NC, Pressler M, Nopoulos P, Miller D, Ho BC. Antipsychotic dose equivalents and dose-years: a standardized method for comparing exposure to different drugs. Biol Psychiatry. 2010;67:255–262. doi: 10.1016/j.biopsych.2009.08.040. - DOI - PMC - PubMed
    1. Anticevic A, Cole MW, Murray JD, Corlett PR, Wang XJ, Krystal JH. The role of default network deactivation in cognition and disease. Trends Cogn Sci. 2012a;16:584–592. doi: 10.1016/j.tics.2012.10.008. - DOI - PMC - PubMed
    1. Anticevic A, Brumbaugh MS, Winkler AM, Lombardo LE, Barrett J, Corlett PR, Kober H, Gruber J, Repovs G, Cole MW, Krystal JH, Pearlson GD, Glahn DC. Global prefrontal and fronto-amygdala dysconnectivity in bipolar I disorder with psychosis history. Biol Psychiatry. 2013;73:565–573. doi: 10.1016/j.biopsych.2012.07.031. - DOI - PMC - PubMed
    1. Anticevic A, Gancsos M, Murray JD, Repovs G, Driesen NR, Ennis DJ, Niciu MJ, Morgan PT, Surti TS, Bloch MH, Ramani R, Smith M, Wang XJ, Krystal JH, Corlett PR. NMDA receptor function in large-scale anti-correlated neural systems with implications for cognition and schizophrenia. Proc Natl Acad Sci U S A. 2012b;109:16720–16725. doi: 10.1073/pnas.1208494109. - DOI - PMC - PubMed
    1. Anticevic A, Repovs G, Barch DM. Working memory encoding and maintenance deficits in schizophrenia: neural evidence for activation and deactivation abnormalities. Schizophr Bull. 2013a;39:168–178. doi: 10.1093/schbul/sbr107. - DOI - PMC - PubMed

Publication types