. 2015 Feb 15;75(4):656-665.
doi: 10.1158/0008-5472.CAN-14-2377. Epub 2015 Jan 7.

β-catenin promotes regulatory T-cell responses in tumors by inducing vitamin A metabolism in dendritic cells

Affiliations

β-catenin promotes regulatory T-cell responses in tumors by inducing vitamin A metabolism in dendritic cells

Yuan Hong et al. Cancer Res. .

Abstract

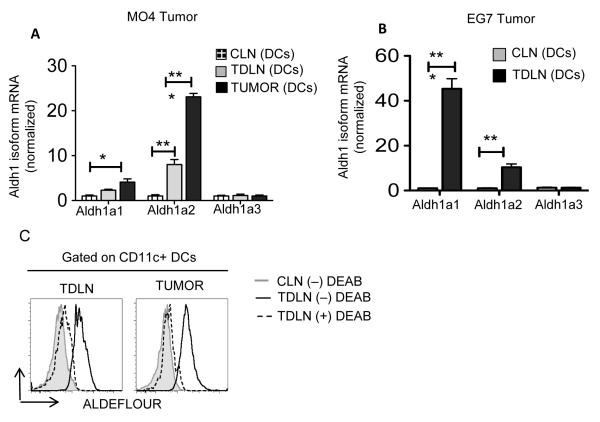
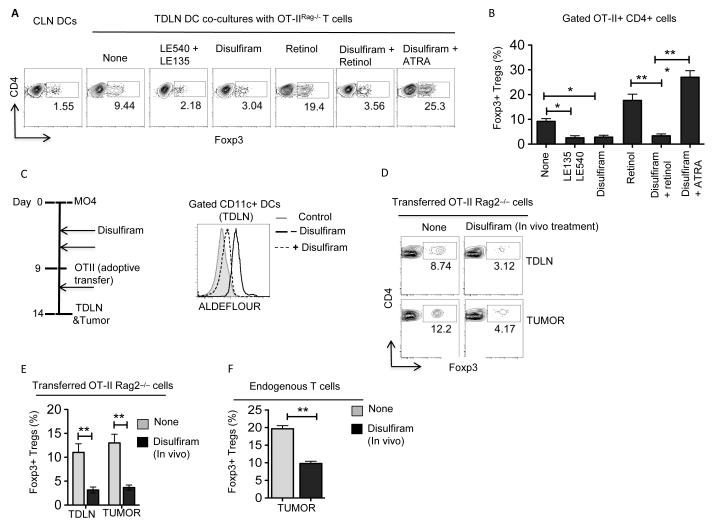
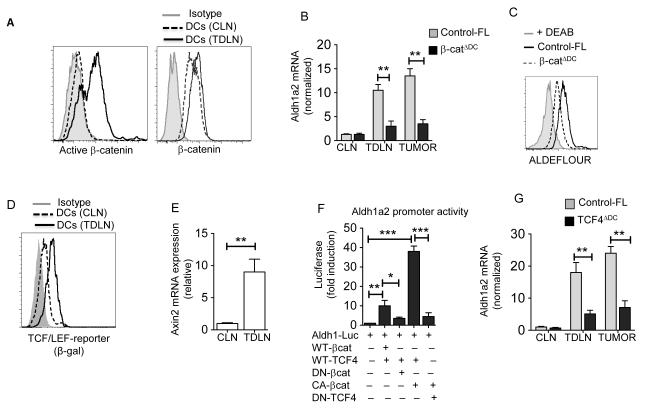
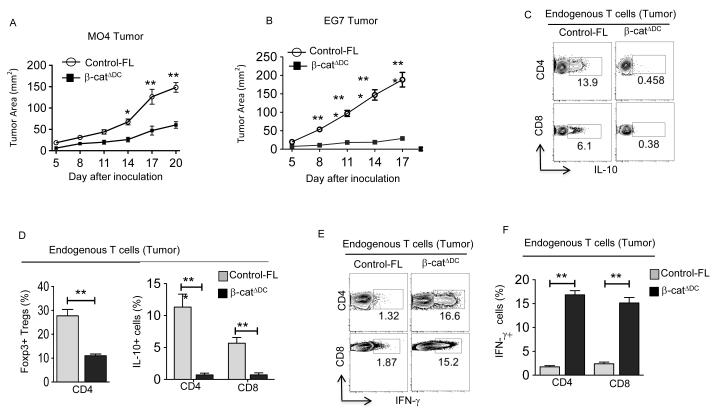
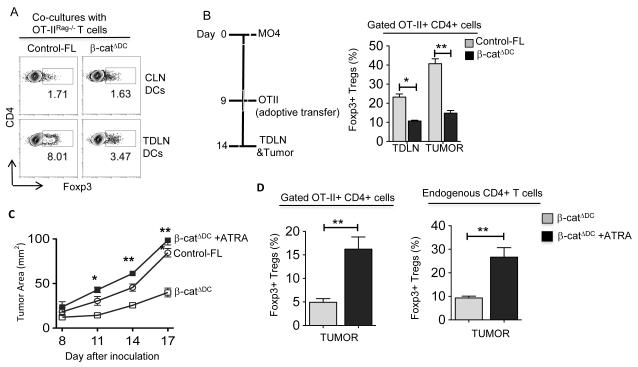
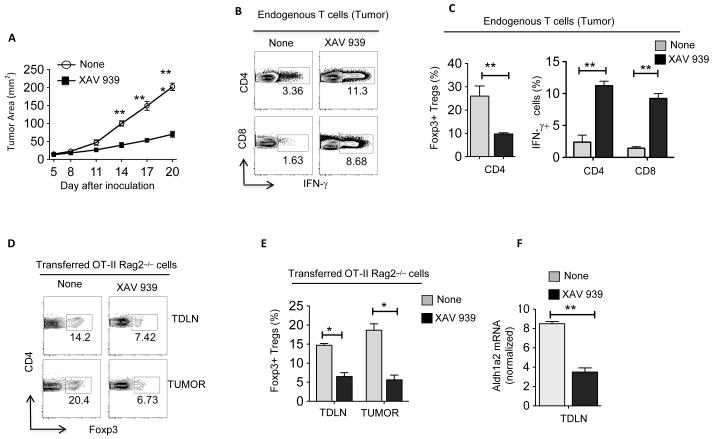
Tumors actively suppress antitumor immunity, creating formidable barriers to successful cancer immunotherapy. The molecular mechanisms underlying tumor-induced immune tolerance are largely unknown. In the present study, we show that dendritic cells (DC) in the tumor microenvironment acquire the ability to metabolize vitamin A to produce retinoic acid (RA), which drives regulatory T-cell responses and immune tolerance. Tolerogenic responses were dependent on induction of vitamin A-metabolizing enzymes via the β-catenin/T-cell factor (TCF) pathway in DCs. Consistent with this observation, DC-specific deletion of β-catenin in mice markedly reduced regulatory T-cell responses and delayed melanoma growth. Pharmacologic inhibition of either vitamin A-metabolizing enzymes or the β-catenin/TCF4 pathway in vivo had similar effects on tumor growth and regulatory T-cell responses. Hence, β-catenin/TCF4 signaling induces local regulatory DC and regulatory T-cell phenotypes via the RA pathway, identifying this pathway as an important target for anticancer immunotherapy.


Figures

Figure 1
Figure 1. DCs express vitamin A-metabolizing enzymes in response to tumor
Real-time PCR analysis of mRNA levels of Aldh1 isoforms (Aldh1a1, Aldh1a2, Aldh1a3) expression in CD11c+ DCs enriched from TDLNs, CLNs and tumors pooled from WT mice on day 9 post-tumor inoculation (A) MO4 and (B) EG7 (n= values are represented in triplicates from two independent experiment with pooled DCs obtained from 5 mice per experiment). (C) Ex vivo analysis of ALDH activity in CD11c+ DCs cells enriched from TDLNs, CLNs and tumors from WT mice (n= cells were pooled from 5-6 tumor bearing mice). DEAB, a specific inhibitor of ALDH, was used as control for background fluorescence. Data are representative of at least two independent experiments. Error bars show mean values ± SD. Statistical levels of significance were analyzed by the Student t test (unpaired). *, P<0.05; **, P<0.01; ***, P<0.001.
Figure 2
Figure 2. RA in TME induces Foxp3+ Treg cells
(A and B) CD11c+ DCs were sorted from TDLNs and CLNs of MO4 tumor bearing WT mice on day 9-11 post-tumor inoculation and were treated with or without disulfiram (1 μM). After 3 h, DCs were washed and co-cultured with CD4+CD25 cells from Rag−/−OTII mice in RPMI1640 medium containing OVA peptide (2 μg/ml) and TGFβ (1 ng/ml), in the presence or absence of LE540+LE135 (1 μM) or retinol (1 μM) or ATRA (all-trans retinoic acid) (5 nM) combination for 5 days. Representative FACS plots (A) and frequencies (B) of Foxp3+CD4+ T (n=3; DCs were pooled from 5 to 6 mice and experiment was repeated at least two times). (C) Ex vivo analysis of ALDH activity in CD11c+ DCs enriched from TDLNs, CLNs and tumors from WT mice treated with or without disulfiram on day 14 post-tumor inoculation. DEAB, a specific inhibitor of ALDH, was used as control for background fluorescence. Data shown are representative histograms gated on CD45+ CD11c+ cells from one experiment of two independent experiments. DCs were pooled from 5 to 6 tumor bearing mice for each experiment. (D and E) MO4 bearing mice treated with or without disulfiram were adoptively transferred with OT-II T cells from Rag−/−OTII mice on day 9 after tumor inoculation. After 5 days, FACS analysis was performed on CD45+Vα2+Vβ5.1/5.2+ CD4+ T cells from TDLNs and tumor tissues. (D) Data shown are percentage and representative dot plots of OVA-specific Foxp3+CD4+ T cells. (n=3 to 4 mice per experiment. Experiment was repeated two times). (E) Data are from experiment (D) showing cumulative frequencies of adoptively OVA-specific Foxp3+CD4+ T cells and show mean values ± SEM (n 6 to 8 mice). Error bars show mean values ± SEM. Statistical levels of significance were analyzed by the Student t test (unpaired) * P<0.05; ** P<0.01; *** P<0.001.
Figure 3
Figure 3. β-catenin/TCF4 pathway induces vitamin A-metabolizing enzymes in DCs
(A) Representative histograms showing active-β-catenin (Left) and β-catenin (Right) expression in CD11c+ cells from MO4 tumor TDLN and CLN of tumor-free C57BL/6 (WT) mice on day 9 post tumor inoculation. (B) Real-time PCR analysis of Aldh1a2 expression from TDLNs, CLNs and tumors (n=3) and (C) Ex vivo analysis of ALDH activity in CD11c+ DCs enriched from TDLNs from β-catΔDC and control-FL mice. (D) Representative histograms showing β-gal expression in CD11c+ cells from TDLNs and CLNs of TCF/LEF-LacZ reporter mice. (E) Axin2 mRNA expression analyzed by qRTPCR in TDLNs and CLNs on day 9 post inoculation (n=). The result represents fold increase over the CLNs. (F) Aldh1a2 promoter activity in 293T cell after 24 h transfection reporter plasmid alone or co-transfected with WT-β-catenin (WT-βcat), dominant negative β-catenin (DN-βcat), Active β-catenin (CA-βcat), WT-TCF4 or dominant negative TCF4 (DN-TCF4) expression vectors. The results are represented as fold activation relative to Aldh1 promoter vector transfection control alone (G) Real-time PCR analysis of Aldh1a2 expression in CD11c+ DCs enriched from TDLNs, CLNs and tumors from TCF4ΔDC and control-FL mice. Iso: isotype control. DCs were enriched and pooled from 5 to 6 tumor bearing mice (A, C and D). Each sample was done in triplicate; the average and SD are shown. The experiment was repeated atleast two (B, E and G) or three (F) times with similar results. Error bars show mean values ± SEM. Statistical levels of significance were analyzed by the Student t test (unpaired) * P<0.05; ** P<0.01; *** P<0.001.
Figure 4
Figure 4. DC-specific deletion of β-catenin enhances antitumor immunity in mice
(A) MO4 melanoma progression in β-catΔDC and Control-FL mice (n=10-12). (B) EG-7 tumor progression in β-catΔDC and Control-FL mice (n=6-8). (C-F) Representative dot plots and percentages of IL-10+CD4+, Foxp3+CD4+, IL-10+CD8+, IFN-γ+CD4+ and IFN-γ+CD8+ T cells isolated from MO4 melanoma in Control-FL and β-catΔDC mice on day 14 post inoculation (n=5 to 6 mice). Data are representative of two independent experiments and show mean values ± SEM. Statistical levels of significance were analyzed by the Student t test (unpaired). *, P<0.05; **, P<0.01; *** P<0.001.
Figure 5
Figure 5. Loss of β-catenin impairs DCs ability to induce Treg cells differentiation and ATRA treatment can restore it
(A) CD11c+ cells were sorted from CLNs (Top Panels) and TDLNs (Bottom Panels) of MO4 tumor bearing β-catΔDC and control-FL mice and were co-cultured with CD4+CD25 naïve T cells as described in Fig 2A. Data are shown as percentage and representative dot plots of Foxp3+CD4+ T cells of one experiment of two independent experiments (DCs were pooled and enriched from 5 to 6 mice for each experiment). Each sample was done in triplicate. (B) In vivo OT-II Treg differentiation in β-catΔDC and control-FL mice was performed as described in Fig 2D. Data are represents cumulative percentage of OVA-specific Foxp3+CD4+ T cells in TDLNs and tumors isolated from β-catΔDC and control-FL mice. (n=5-6). (C) The MO4 melanoma progression in β-catΔDC mice treated with or without ATRA (2.5 mg/kg) every 3 days from day 1 after tumor inoculation. Data are mean tumor size and are cumulative representative of two independent experiments β-catΔDC versus β-catΔDC +ATRA. (n=6-8 mice; Combined results of two independent experiments are shown). (D) In vivo OT-II Treg differentiation in β-catΔDC treated with or without ATRA was performed as describe in Fig 2D. Percentage of OVA-specific Foxp3+CD4+ Treg cells and endogenous Foxp3+CD4+ Treg cells in TDLNs and tumors isolated from β-catΔDC and Control-FL mice treated with or without ATRA (n= 6 to 8 mice). Data represent two independent experiments and show mean values ± SEM. Statistical levels of significance were analyzed by the Student t test (unpaired). *, P<0.05; **, P<0.01; ***, P<0.001.
Figure 6
Figure 6. Therapeutic effect of blocking the β-catenin pathway against established tumors
The MO4 melanoma progression in WT mice treated with or without XAV 939 (2 mg/kg) every 3 days from day 5 after tumor inoculation. (A) Data are mean tumor size and are cumulative representative of two independent experiments (n= 10-12 mice; Data show combined results of two independent experiments with 5 to 6 mice per experiment). (B and C) Representative dot plots and percentage of IFN-γ+CD4+, IFN-γ+CD8+ and Foxp3+CD4+ T cells isolated from MO4 on day 20 post inoculation. (D, E) In vivo OT-II Treg differentiation in WT mice treated with or without XAV 939 was performed as describe in Fig 2D. Data are representative dot plots (D) and cumulative percentage (E) of induced OVA-specific Foxp3+CD4+ Treg cells isolated from TDLN and tumor (n= 5 to 6 per sample). Data are representative of two independent experiments and show mean values ± SEM. Combined results of two separate experiments are shown with 5-6 mice/group in each experiment. (F) Real-time PCR analysis of Aldh1a2 expression in CD11c+ DCs enriched from TDLNs from WT mice treated with or without XAV 939. Each sample was done in triplicate; the average and SD are shown. The experiment was repeated two times with similar results. Statistical levels of significance were analyzed by the Student t test (unpaired) *, P<0.05; **, P<0.01; ***, P<0.001.

References

    1. Rabinovich GA, Gabrilovich D, Sotomayor EM. Immunosuppressive strategies that are mediated by tumor cells. Annual review of immunology. 2007;25:267–96. - PMC - PubMed
    1. Chen DS, Mellman I. Oncology meets immunology: the cancer-immunity cycle. Immunity. 2013;39(1):1–10. - PubMed
    1. Flavell RA, Sanjabi S, Wrzesinski SH, Licona-Limon P. The polarization of immune cells in the tumour environment by TGFbeta. Nature reviews Immunology. 2010;10(8):554–67. - PMC - PubMed
    1. Munn DH, Mellor AL. Indoleamine 2,3-dioxygenase and tumor-induced tolerance. The Journal of clinical investigation. 2007;117(5):1147–54. - PMC - PubMed
    1. Palucka K, Banchereau J. Cancer immunotherapy via dendritic cells. Nature reviews Cancer. 2012;12(4):265–77. - PMC - PubMed

Publication types

MeSH terms