Multicenter Study
. 2015 Feb 3;84(5):508-15.
doi: 10.1212/WNL.0000000000001209. Epub 2015 Jan 7.

Mild cognitive impairment with suspected nonamyloid pathology (SNAP): Prediction of progression

Collaborators, Affiliations
Multicenter Study

Mild cognitive impairment with suspected nonamyloid pathology (SNAP): Prediction of progression

Anna Caroli et al. Neurology. .

Abstract

Objectives: The aim of this study was to investigate predictors of progressive cognitive deterioration in patients with suspected non-Alzheimer disease pathology (SNAP) and mild cognitive impairment (MCI).

Methods: We measured markers of amyloid pathology (CSF β-amyloid 42) and neurodegeneration (hippocampal volume on MRI and cortical metabolism on [(18)F]-fluorodeoxyglucose-PET) in 201 patients with MCI clinically followed for up to 6 years to detect progressive cognitive deterioration. We categorized patients with MCI as A+/A- and N+/N- based on presence/absence of amyloid pathology and neurodegeneration. SNAPs were A-N+ cases.

Results: The proportion of progressors was 11% (8/41), 34% (14/41), 56% (19/34), and 71% (60/85) in A-N-, A+N-, SNAP, and A+N+, respectively; the proportion of APOE ε4 carriers was 29%, 70%, 31%, and 71%, respectively, with the SNAP group featuring a significantly different proportion than both A+N- and A+N+ groups (p ≤ 0.005). Hypometabolism in SNAP patients was comparable to A+N+ patients (p = 0.154), while hippocampal atrophy was more severe in SNAP patients (p = 0.002). Compared with A-N-, SNAP and A+N+ patients had significant risk of progressive cognitive deterioration (hazard ratio = 2.7 and 3.8, p = 0.016 and p < 0.001), while A+N- patients did not (hazard ratio = 1.13, p = 0.771). In A+N- and A+N+ groups, none of the biomarkers predicted time to progression. In the SNAP group, lower time to progression was correlated with greater hypometabolism (r = 0.42, p = 0.073).

Conclusions: Our findings support the notion that patients with SNAP MCI feature a specific risk progression profile.


Figures

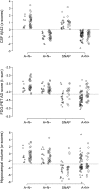
Figure 1
Figure 1. Biomarker abnormality in A−N−, A+N−, SNAP, and A+N+ MCI patient groups, disaggregated by progressive cognitive deterioration
Triangles denote progressors, while circles denote nonprogressors. Data were jittered to prevent overplotting. For FDG-PET AD t-sum biomarker, logarithmic scores (log10) were polarized to improve visualization, with abnormal scores below the threshold line and toward the negative end of the distribution. Aβ42 = β-amyloid 1–42; AD = Alzheimer disease; FDG = [18F]-fluorodeoxyglucose; MCI = mild cognitive impairment; SNAP = suspected non-AD pathology.
Figure 2
Figure 2. Risk of progressive cognitive deterioration in 34 SNAP, 41 A+N−, and 85 A+N+ patients with MCI, compared with 41 A−N− patients with MCI as the reference
The + denotes censored cases. Adjusted by age, baseline Mini-Mental State Examination score, and APOE ε4 carrier status. Crude and adjusted HRs were computed in 6 separate Cox regression models. SNAP and A+N+ patients had significant risk of progressive cognitive deterioration, while A+N− patients did not. CI = confidence interval; HR = hazard ratio; MCI = mild cognitive impairment; SNAP = suspected non–Alzheimer disease pathology.
Figure 3
Figure 3. Linear correlation between time to progression and FDG-PET in the 19 SNAP progressors
FDG-PET t-sum scores were polarized for more negative values to denote greater abnormality. Lower time to progression was linearly correlated with greater hypometabolism. AD = Alzheimer disease; FDG = [18F]-fluorodeoxyglucose; MCI = mild cognitive impairment; SNAP = suspected non-AD pathology.

References

    1. Ingelsson M, Fukumoto H, Newell KL, et al. Early Abeta accumulation and progressive synaptic loss, gliosis, and tangle formation in AD brain. Neurology 2004;62:925–931. - PubMed
    1. Jack CR, Jr, Lowe VJ, Weigand SD, et al. ; Alzheimer's Disease Neuroimaging Initiative. Serial PIB and MRI in normal, mild cognitive impairment and Alzheimer's disease: implications for sequence of pathological events in Alzheimer's disease. Brain 2009;132:1355–1365. - PMC - PubMed
    1. Jack CR, Jr, Knopman DS, Jagust WJ, et al. Hypothetical model of dynamic biomarkers of the Alzheimer's pathological cascade. Lancet Neurol 2010;9:119–128. - PMC - PubMed
    1. Jack CR, Jr, Holtzman DM. Biomarker modeling of Alzheimer's disease. Neuron 2013;80:1347–1358. - PMC - PubMed
    1. Sperling RA, Aisen PS, Beckett LA, et al. Toward defining the preclinical stages of Alzheimer's disease: recommendations from the National Institute on Aging–Alzheimer's Association workgroups on diagnostic guidelines for Alzheimer's disease. Alzheimers Dement 2011;7:280–292. - PMC - PubMed

Publication types