The Bcl-2 inhibitor Obatoclax overcomes resistance to histone deacetylase inhibitors SAHA and LBH589 as radiosensitizers in patient-derived glioblastoma stem-like cells
- PMID: 25568669
- PMCID: PMC4279441
- DOI: 10.18632/genesandcancer.42
The Bcl-2 inhibitor Obatoclax overcomes resistance to histone deacetylase inhibitors SAHA and LBH589 as radiosensitizers in patient-derived glioblastoma stem-like cells
Abstract
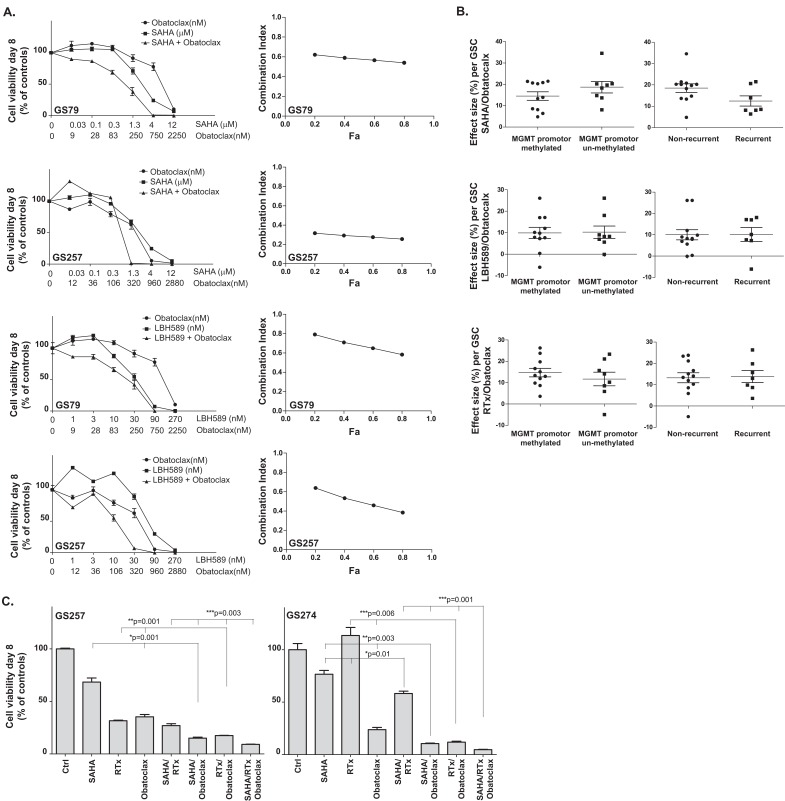
Glioblastoma has shown resistance to histone deacetylase inhibitors (HDACi) as radiosensitizers in cultures with Bcl-XL over-expression. We study the efficacy of SAHA/RTx and LBH589/RTx when manipulating Bcl-2 family proteins using the Bcl-2 inhibitor Obatoclax in patient-derived glioblastoma stem-like cell (GSC) cultures. GSC cultures in general have a deletion in phosphatase and tensin homolog (PTEN). Synergy was determined by the Chou Talalay method. The effects on apoptosis and autophagy were studied by measuring caspase-3/7, Bcl-XL, Mcl-1 and LC3BI/II proteins. The relation between treatment response and O6-methylguanine-DNA methyltransferase (MGMT) promoter methylation status, recurrence and gene expression levels of the tumors were studied. Obatoclax synergized with SAHA and LBH589 and sensitized cells to HDACi/RTx. Over 50% of GSC cultures were responsive to Obatoclax with either single agent. Combined with HDACi/RTx treatment, Obatoclax increased caspase-3/7 and inhibited Bcl-2 family proteins Bcl-XL and Mcl-1 more effectively than other treatments. Genes predictive for treatment response were identified, including the F-box/WD repeat-containing protein-7, which was previously related to Bcl-2 inhibition and HDACi sensitivity. We emphasize the functional relation between Bcl-2 proteins and radiosensitization by HDACi and provide a target for increasing responsiveness in glioblastoma by using the Bcl-2 inhibitor Obatoclax.
Keywords: Bcl-2; Bcl-XL; HDAC inhibitor; LBH589; Obatoclax; SAHA; radiation.
Figures


Similar articles
-
DNA damage response and anti-apoptotic proteins predict radiosensitization efficacy of HDAC inhibitors SAHA and LBH589 in patient-derived glioblastoma cells.Cancer Lett. 2015 Jan 28;356(2 Pt B):525-35. doi: 10.1016/j.canlet.2014.09.049. Epub 2014 Oct 8. Cancer Lett. 2015. PMID: 25305451
-
The HDAC Inhibitors Scriptaid and LBH589 Combined with the Oncolytic Virus Delta24-RGD Exert Enhanced Anti-Tumor Efficacy in Patient-Derived Glioblastoma Cells.PLoS One. 2015 May 18;10(5):e0127058. doi: 10.1371/journal.pone.0127058. eCollection 2015. PLoS One. 2015. PMID: 25993039 Free PMC article.
-
The histone deacetylase inhibitor LBH589 inhibits undifferentiated pleomorphic sarcoma growth via downregulation of FOS-like antigen 1.Mol Carcinog. 2019 Feb;58(2):234-246. doi: 10.1002/mc.22922. Epub 2018 Nov 2. Mol Carcinog. 2019. PMID: 30303565
-
Krüppel-like factor 9 and histone deacetylase inhibitors synergistically induce cell death in glioblastoma stem-like cells.BMC Cancer. 2018 Oct 22;18(1):1025. doi: 10.1186/s12885-018-4874-8. BMC Cancer. 2018. PMID: 30348136 Free PMC article.
-
Histone Deacetylase Inhibitor-Induced Autophagy in Tumor Cells: Implications for p53.Int J Mol Sci. 2017 Aug 31;18(9):1883. doi: 10.3390/ijms18091883. Int J Mol Sci. 2017. PMID: 30563957 Free PMC article. Review.
Cited by
-
The signature of immune-subtype specific driving transcription factors suggest potential drugs for refractory glioblastoma.Am J Cancer Res. 2023 Apr 15;13(4):1278-1294. eCollection 2023. Am J Cancer Res. 2023. PMID: 37168341 Free PMC article.
-
miR-29b-3p Increases Radiosensitivity in Stemness Cancer Cells via Modulating Oncogenes Axis.Front Cell Dev Biol. 2021 Sep 16;9:741074. doi: 10.3389/fcell.2021.741074. eCollection 2021. Front Cell Dev Biol. 2021. PMID: 34604239 Free PMC article.
-
Synergy of BCL2 and histone deacetylase inhibition against leukemic cells from cutaneous T-cell lymphoma patients.Blood. 2017 Nov 9;130(19):2073-2083. doi: 10.1182/blood-2017-06-792150. Epub 2017 Oct 2. Blood. 2017. PMID: 28972015 Free PMC article.
-
Ionophores: Potential Use as Anticancer Drugs and Chemosensitizers.Cancers (Basel). 2018 Sep 27;10(10):360. doi: 10.3390/cancers10100360. Cancers (Basel). 2018. PMID: 30262730 Free PMC article. Review.
-
In vitro screening of clinical drugs identifies sensitizers of oncolytic viral therapy in glioblastoma stem-like cells.Gene Ther. 2015 Dec;22(12):947-59. doi: 10.1038/gt.2015.72. Epub 2015 Jul 21. Gene Ther. 2015. PMID: 26196249
References
-
- DeAngelis LM. Brain tumors. N Engl J Med. 2001;344(2):114–123. - PubMed
-
- Stupp R, Mason WP, van den Bent MJ, Weller M, Fisher B, Taphoorn MJ, Belanger K, Brandes AA, Marosi C, Bogdahn U, Curschmann J, Janzer RC, Ludwin SK, Gorlia T, Allgeier A, Lacombe D, et al. Radiotherapy plus concomitant and adjuvant temozolomide for glioblastoma. The New England journal of medicine. 2005;352(10):987–996. - PubMed
-
- Stupp R, Hegi ME, Mason WP, van den Bent MJ, Taphoorn MJ, Janzer RC, Ludwin SK, Allgeier A, Fisher B, Belanger K, Hau P, Brandes AA, Gijtenbeek J, Marosi C, Vecht CJ, Mokhtari K, et al. Effects of radiotherapy with concomitant and adjuvant temozolomide versus radiotherapy alone on survival in glioblastoma in a randomised phase III study: 5-year analysis of the EORTC-NCIC trial. Lancet Oncol. 2009;10(5):459–466. - PubMed
-
- Hegi ME, Diserens AC, Godard S, Dietrich PY, Regli L, Ostermann S, Otten P, Van Melle G, de Tribolet N, Stupp R. Clinical trial substantiates the predictive value of O-6-methylguanine-DNA methyltransferase promoter methylation in glioblastoma patients treated with temozolomide. Clin Cancer Res. 2004;10(6):1871–1874. - PubMed
LinkOut - more resources
Full Text Sources
Other Literature Sources
Research Materials