. 2015 Jan 8;6(1):e1583.
doi: 10.1038/cddis.2014.541.

Long non-coding RNA CCAT1 promotes gallbladder cancer development via negative modulation of miRNA-218-5p

Affiliations

Long non-coding RNA CCAT1 promotes gallbladder cancer development via negative modulation of miRNA-218-5p

M-Z Ma et al. Cell Death Dis. .

Abstract

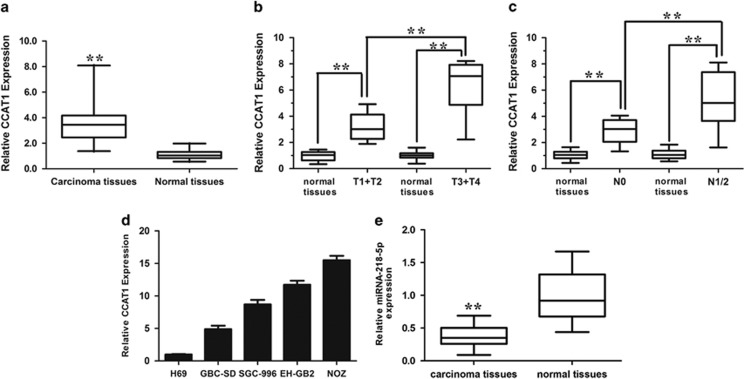
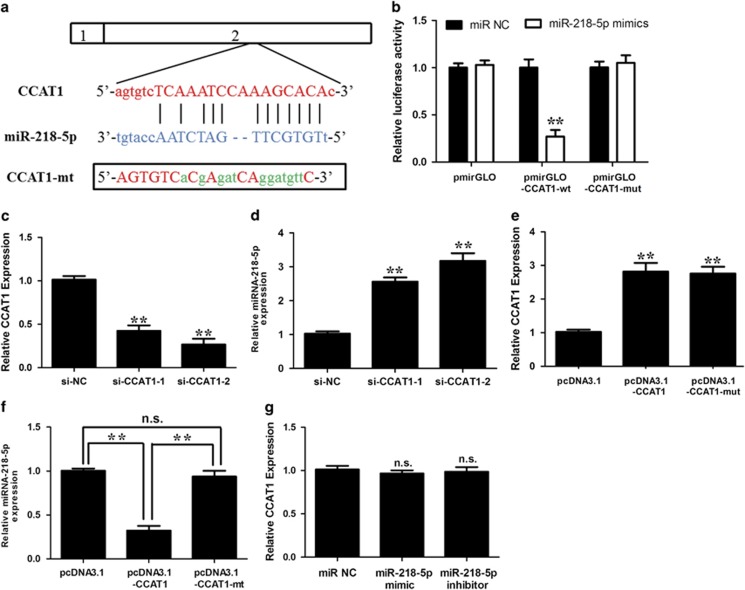
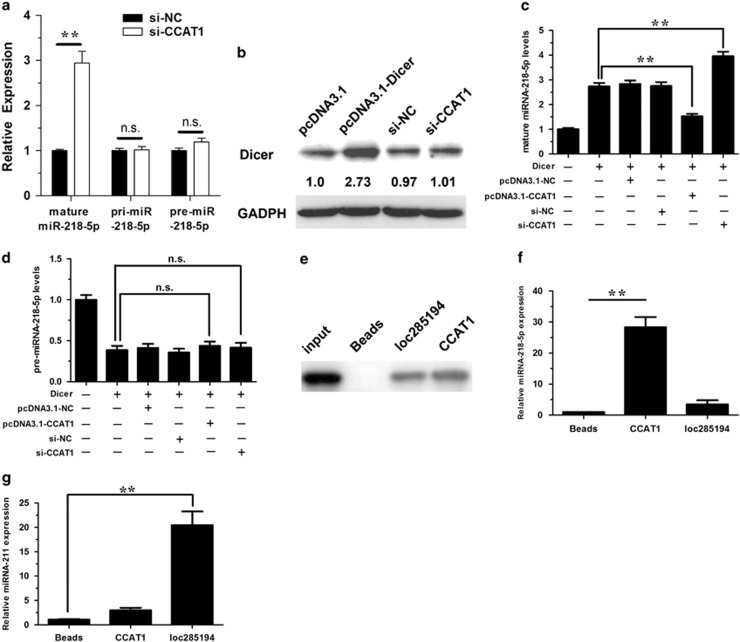
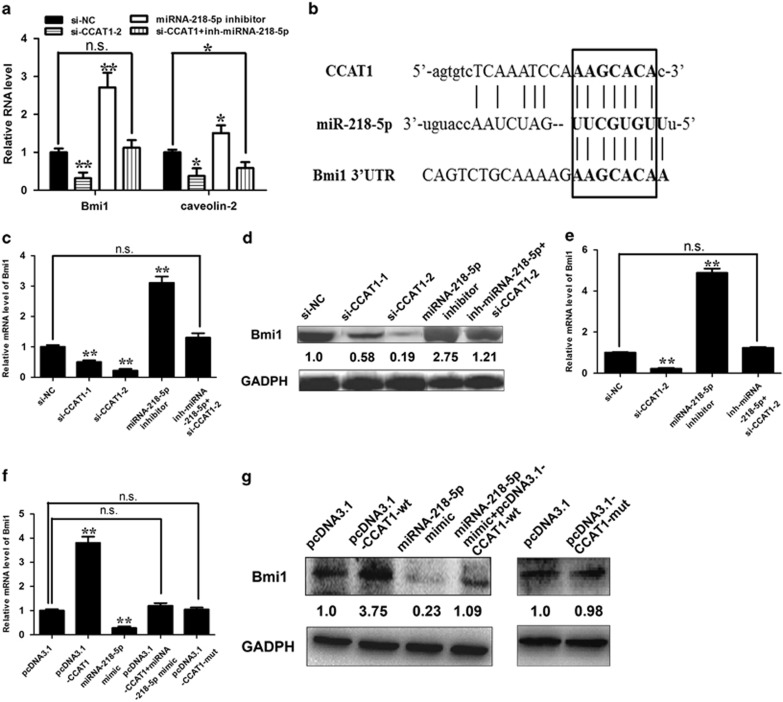
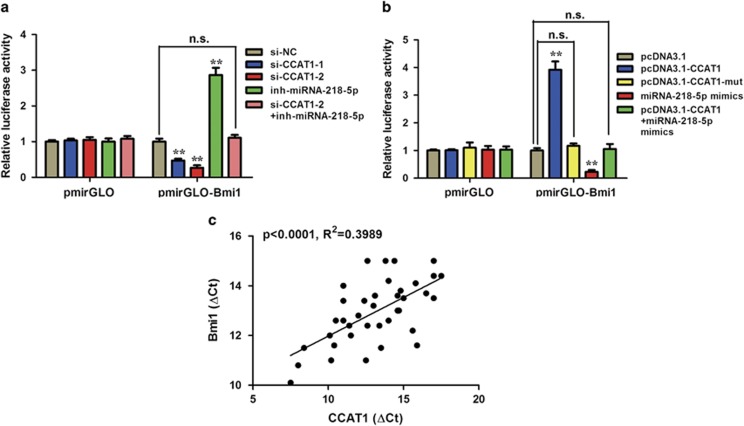
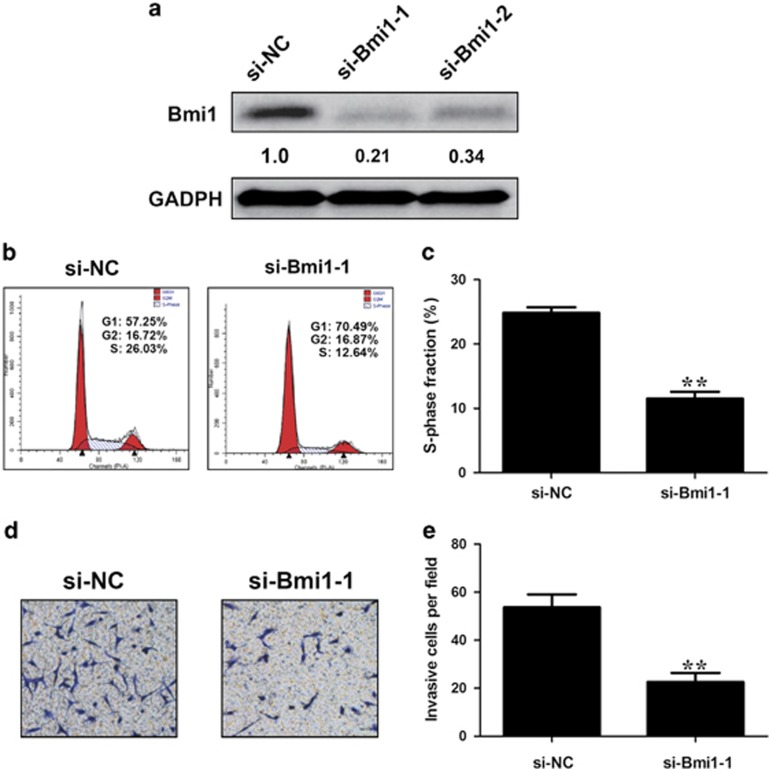
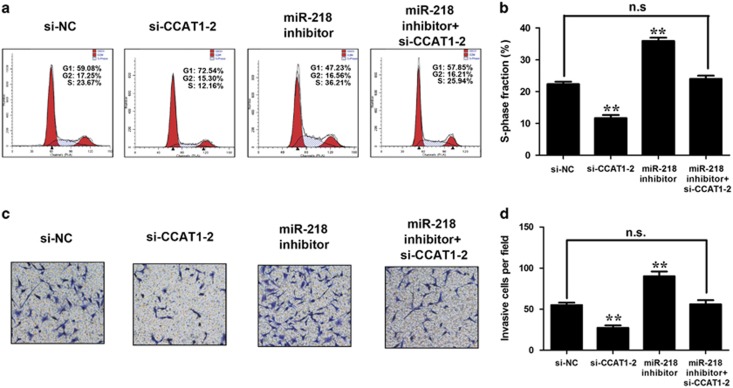
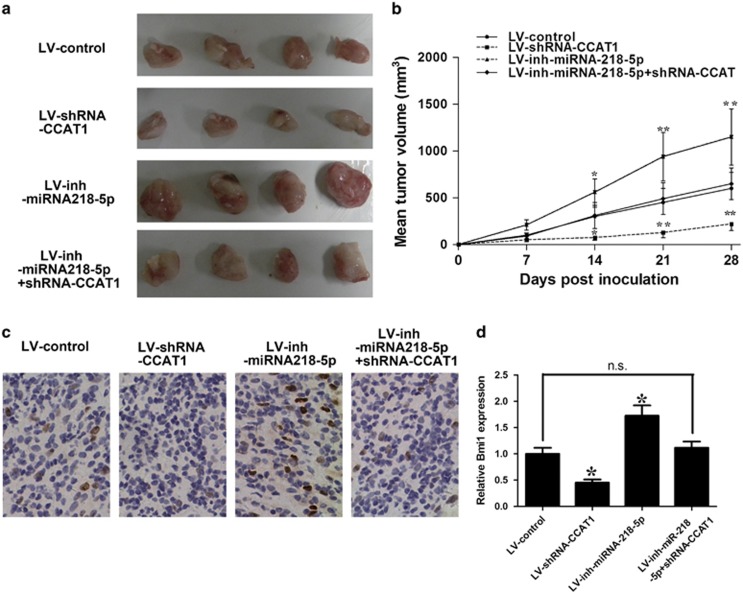
Protein-coding genes account for only ~2% of the human genome, whereas the vast majority of transcripts are non-coding RNAs (ncRNAs) including long ncRNAs (lncRNAs). A growing volume of literature has proposed that lncRNAs are important factors in cancer. Colon cancer-associated transcript-1 (CCAT1), an lncRNA, which was first identified in colon cancer, was previously shown to promote tumor development and be a negative prognostic factor in gastric cancer. However, the mechanism through which CCAT1 exerts its oncogenic activity remains largely unknown. Recently, a novel regulatory mechanism has been proposed in which RNAs can cross-talk with each other via competing shared for microRNAs (miRNAs). The proposed competitive endogenous RNAs could mediate the bioavailability of miRNAs on their targets, thus imposing another level of posttranscriptional regulation. In this study, we demonstrated that CCAT1 was upregulated in gallbladder cancer (GBC) tissues. CCAT1 silencing downregulated, whereas CCAT1 overexpression enhanced the expression of miRNA-218-5p target gene Bmi1 through competitively 'spongeing' miRNA-218-5p. Our data revealed that CCAT1 knockdown impaired the proliferation and invasiveness of GBC cells, at least in part through affecting miRNA-218-5p-mediated regulation of Bmi1. Moreover, CCAT1 transcript level was correlated with Bmi1 mRNA level in GBC tissues. Together, these results suggest that CCAT1 is a driver of malignancy, which acts in part through 'spongeing' miRNA-218-5p.


Figures

Figure 1
Figure 1
Expression levels of CCAT1 and miRNA-218-5p in GBC and its clinical significance. (a) Difference in expression levels of CCAT1 between GBC tissues and matched non-tumor gallbladder tissues. The expression of CCAT1 was normalized to GADPH. The statistical differences between samples were analyzed with paired samples t-test (n=40, P<0.0001). (b) Relationship between CCAT1 expression and primary tumor growth (P<0.0001). The expression of CCAT1 in T1+T2/T3+T4 stage tumors was normalized to correspondingly paired normal tissues. (c) Relationship between CCAT1 expression and lymph node metastasis (P<0.0001). The expression of CCAT1 in N1+2/N0 stage tumors was normalized to correspondingly paired normal tissues. The relative expression fold change of mRNAs was calculated by the 2−ΔΔCt method. Horizontal lines in the box plots represent the medians, the boxes represent the interquartile range and the whiskers represent the 2.5th and 97.5th percentiles. (d) Expression levels of CCAT1 in four GBC cell lines (GBC-SD, SGC-996, EH-GB2 and NOZ) and a non-tumorigenic biliary epithelial cell line (H69). The expression of CCAT1 was normalized to that in H69. The statistical differences between groups were analyzed using independent samples t-test. Error bars represent the mean±S.D. of triplicate experiments. *P<0.05; **P<0.01. (e) miRNA-218-5p is downregulated in GBC tissues compared with paired adjacent normal gallbladder tissues. miRNA-218-5p mRNA expression was analyzed by real-time PCR and normalized to GADPH. The relative expression fold change of mRNAs was calculated by the 2−ΔΔCt method. Horizontal lines in the box plots represent the medians, the boxes represent the interquartile range and the whiskers represent the 2.5th and 97.5th percentiles. The statistical differences between samples were analyzed with paired samples t-test (n=40, P<0.0001)
Figure 2
Figure 2
Identification of miRNA-218-5p as a target of CCAT1. (a) Alignment of potential CCAT1 base pairing with miRNA-218-5p as identified by Starbase v2.0 (http://starbase.sysu.edu.cn/mirLncRNA.php). CCAT1 (top) consist of two exons, where the putative binding site is in exon 2. The mutant CCAT1 at putative binding site. (b) Luciferase activity in NOZ cells cotransfected with miRNA-218-5p mimics and luciferase reporters containing nothing, CCAT1 or mutant transcripts. Data are presented as the relative ratio of firefly luciferase activity of Renilla luciferase activity. (c) CCAT1-specific siRNA 1,2 reduced the endogenous CCAT1 mRNA level in NOZ cells. (d) Upregulation of miRNA-218-5p by si-CCAT1. NOZ cells were transfected with control siRNA or si-CCAT1-1/2, and total RNA was isolated 48 h after transfection. (e) CCAT1-wt or CCAT1-mut was overexpressed in GBC-SD cells. The expression level of mutant clone is similar to that of WT overexpression clone. (f) This mutant CCAT1 clone revealed no significant suppression of miRNA-218-5p compared with wild-type of CCAT1. (g) GBC-SD cells were transfected with miRNA-218-5p mimics or inhibitor, and total RNA was isolated 48 h after transfection. Error bars represent the mean±S.D. of triplicate experiments. *P<0.05; **P<0.01; n.s., not significant
Figure 3
Figure 3
The underlying mechanism of the negative regulation of miRNA-218-5p by CCAT1. (a) Effect of CCAT1 on mature miRNA-218-5p, pri-miRNA-218-5p and pre-miRNA-218-5p. (b) NOZ cells were transfected with pcDNA3.1 or pcDNA3.1-Dicer, or si-NC or si-CCAT1 for 48 h, and western blot analysis was performed. (c and d) NOZ cells were cotransfected with pcDNA3.1-Dicer and pcDNA3.1-CCAT1 or si-CCAT1. Forty-eight hours after transfection, cells were collected. Mature miRNA-218-5p (c) and pre-miRNA-218-5p (d) were analyzed by qRT-PCR. (e) Pull-down of Ago2 by biotin-labeled CCAT1 or loc285194 RNA probe, as detected by western blotting. The loc285194 lane was composed from the same gel with the same contrast. Empty vector (Beads) was used as a negative control. Loc285194 was used as a positive control. (f and g) RIP followed by microRNA qRT-PCR to detect microRNAs endogenously associated with CCAT1 and loc285194. The expression level of miRNA was normalized to that in empty vector (Beads). Error bars represent the mean±S.D. of triplicate experiments. *P<0.05; **P<0.01, n.s., not significant
Figure 4
Figure 4
Regulation of Bmi1 by CCAT1. (a) NOZ cells were transfected with si-NC, si-CCAT1, si-CCAT1+miRNA-218-5p inhibitor and miRNA-218-5p inhibitor. qRT-PCR was performed 48 h post transfection. (b) Nucleotide resolution of miRNA-binding sites in CCAT1 and Bmi1. As indicated, CCAT1 and Bmi1 shared the same miRNA-responsive element in their sequences. miRNA-218-5p is a validated Bmi1-targeting miRNA. The mRNA (c) or protein (d) levels of Bmi1 in NOZ cells transfected with si-NC, si-CCAT1, si-CCAT1+miRNA-218-5p inhibitor and miRNA-218-5p inhibitor. (e) The mRNA levels of Bmi1 in GBC-SD cells transfected with si-NC, si-CCAT1-2, si-CCAT1-2+miRNA-218-5p inhibitor and miRNA-218-5p inhibitor. The mRNA (f) or protein (g) levels of Bmi1 in GBC-SD cells transfected with pcDNA3.1, pcDNA3.1-CCAT1, miRNA-218-5p mimic, pcDNA3.1-CCAT1+miRNA-218-5p mimic and pcDNA3.1-CCAT1-mut. Error bars represent the mean±S.D. of triplicate experiments. *P<0.05; **P<0.01
Figure 5
Figure 5
Regulation of Bmi1 by CCAT1 depends on the regulation of the 3′-UTR of Bmi1. (a and b) Luciferase activity in NOZ cells (a) transfected with luciferase reporters containing Bmi1 3′-UTR or nothing. Data are represented as the relative ratio of firefly luciferase activity to Renilla luciferase activity. Error bars represent the mean±S.D. of triplicate experiments. *P<0.05; **P<0.01; n.s., not significant. (c) The correlation between CCAT1 transcript level and Bmi1 mRNA level was measured in 40 gallbladder tissues. The ΔCt values (normalized to GADPH) were subjected to Pearson's correlation analysis
Figure 6
Figure 6
Bmi1 promotes the growth and invasion of GBC cells. (a) Bmi1-specific siRNA 1,2 effectively suppressed the protein level of Bmi1. (b, c) Flow cytometric analysis was performed in NOZ cells. Data were expressed as percentage distribution of cells in G0/G1, S and G2/M phases of the cell cycle. (d, e) The invasive ability of NOZ cells can be blocked by Bmi1 downregulation. Error bars represent the mean±S.D. of triplicate experiments. *P<0.05; **P<0.01
Figure 7
Figure 7
CCAT1's oncogenic activity is in part through negative regulation of miR-218 and then modulating Bmi1. (a) Flow cytometric analysis was performed. Data were expressed as percentage distribution of cells in G0/G1, S and G2/M phases of the cell cycle. (b) Si-CCAT1 induced a reduction of S-phase fraction cells in NOZ cells, which can be rescued by miRNA-218 inhibitor. miRNA-218 inhibitor alone increased the percentage of S-phase cells. (c) Forty-eight hours after transfection, transwell invasion assay was performed. (d) The invasive ability of NOZ cells can be blocked by CCAT1 downregulation. The si-CCAT1-blocked invasive ability of NOZ cells was rescued by miRNA-218 inhibitor, and miRNA-218 inhibitor alone increased the invasive ability. Error bars represent the mean±S.D. of triplicate experiments. *P<0.05; **P<0.01; n.s., not significant
Figure 8
Figure 8
CCAT1's oncogenic activity is in part through negative regulation of miRNA-218-5p in vivo. CCAT1 knockdown suppressed tumor growth in subcutaneous implantation mouse models of NOZ cells and miRNA-218-5p inhibitor abrogated this suppression in tumor growth. Tumor volumes (a) and tumor growth curves (b) of subcutaneous implantation models of GBC are shown. (c, d) Immunohistochemical staining of Bmi1 demonstrated that CCAT1 silencing inhibited the aggressive phenotype of gallbladder cells in vivo, as indicated by the expression of Bmi1-positive cells and miRNA-218-5p inhibitor abolished the inhibition.*P<0.05, **P<0.01

References

    1. Zhu AX, Hong TS, Hezel AF, Kooby DA. Current management of gallbladder carcinoma. Oncologist 2010; 15: 168–181. - PMC - PubMed
    1. Jiao Y, Pawlik TM, Anders RA, Selaru FM, Streppel MM, Lucas DJ et al. Exome sequencing identifies frequent inactivating mutations in BAP1, ARID1A and PBRM1 in intrahepatic cholangiocarcinomas. Nat Genet 2013; 45: 1470–1473. - PMC - PubMed
    1. Ooi A, Suzuki S, Nakazawa K, Itakura J, Imoto I, Nakamura H et al. Gene amplification of Myc and its coamplification with ERBB2 and EGFR in gallbladder adenocarcinoma. Anticancer Res 2009; 29: 19–26. - PubMed
    1. Shi X, Sun M, Liu H, Yao Y, Song Y. Long non-coding RNAs: a new frontier in the study of human diseases. Cancer Lett 2013; 339: 159–166. - PubMed
    1. Peng HH, Zhang YD, Gong LS, Liu WD, Zhang Y. Increased expression of microRNA-335 predicts a favorable prognosis in primary gallbladder carcinoma. Onco Targets Ther 2013; 6: 1625–1630. - PMC - PubMed

Publication types