

Systematic review of sub-microscopic P. vivax infections: prevalence and determining factors
- PMID: 25569135
- PMCID: PMC4288718
- DOI: 10.1371/journal.pntd.0003413
Systematic review of sub-microscopic P. vivax infections: prevalence and determining factors
Abstract
Background: Sub-microscopic (SM) Plasmodium infections represent transmission reservoirs that could jeopardise malaria elimination goals. A better understanding of the epidemiology of these infections and factors contributing to their occurrence will inform effective elimination strategies. While the epidemiology of SM P. falciparum infections has been documented, that of SM P. vivax infections has not been summarised. The objective of this study is to address this deficiency.
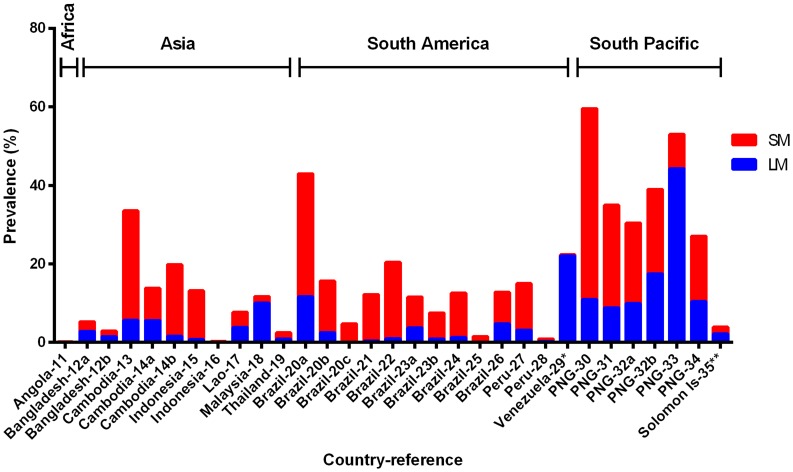
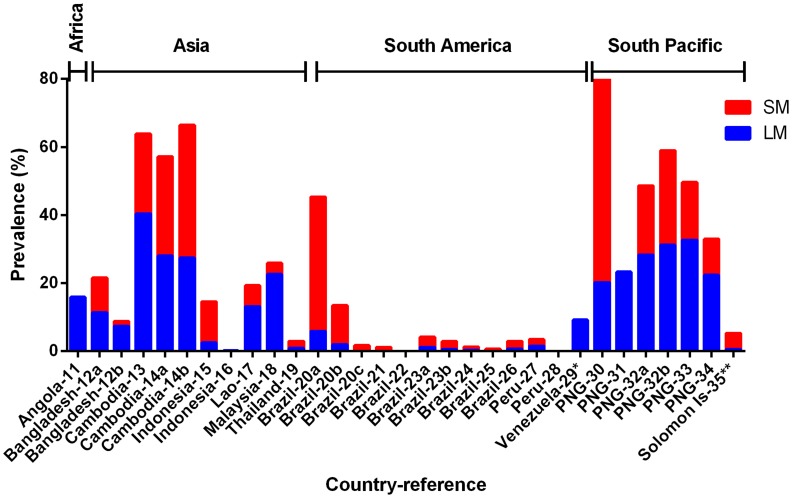
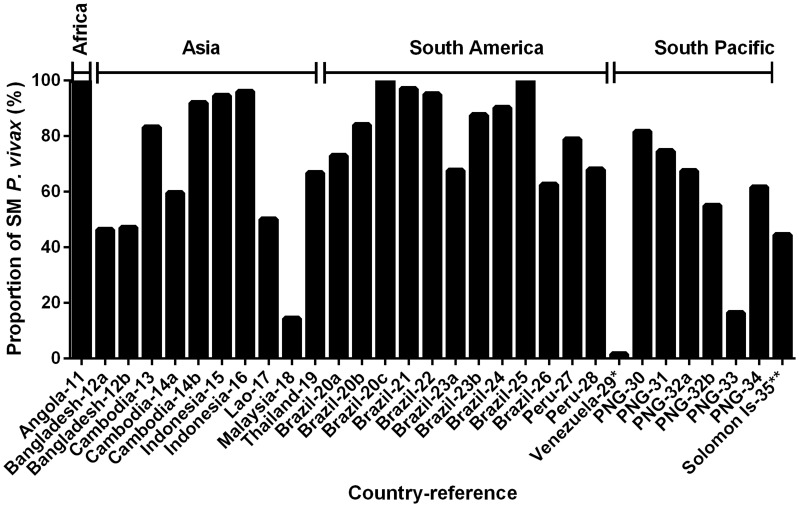
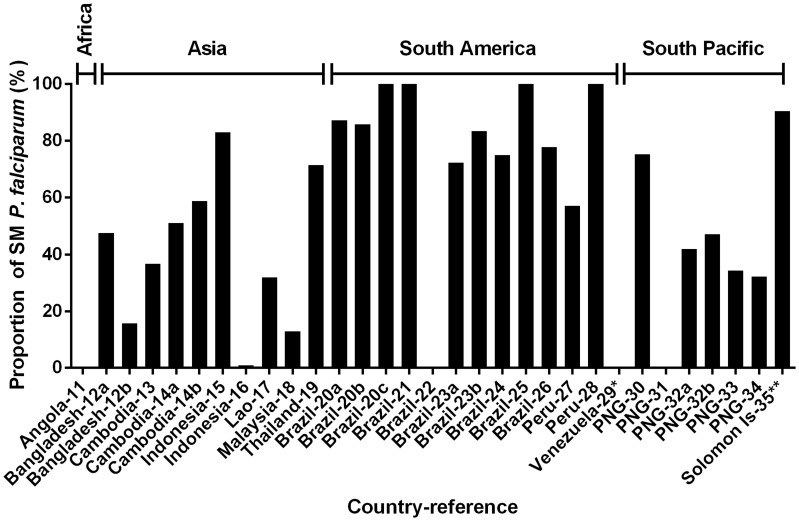
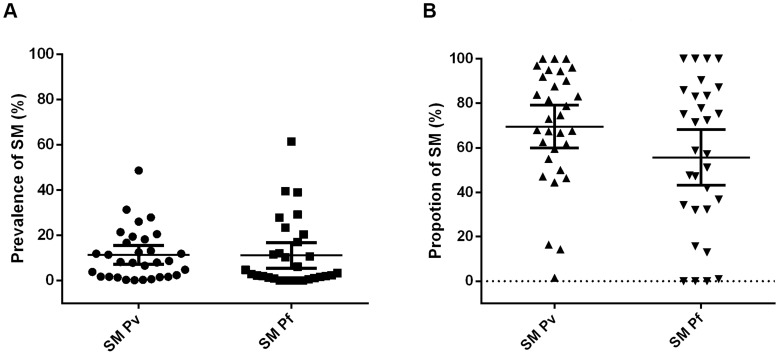
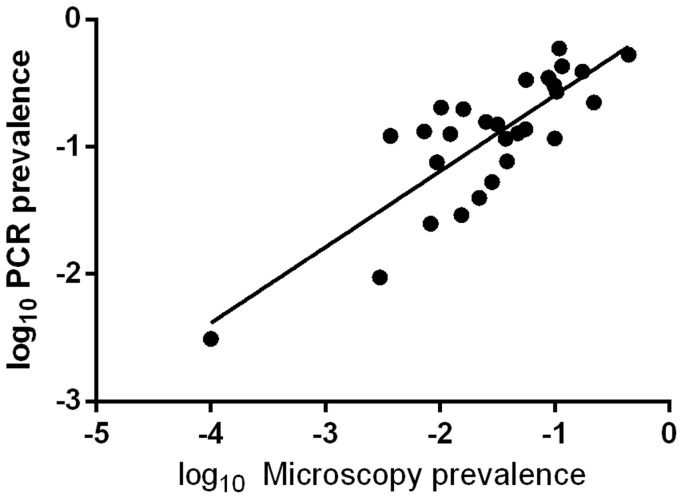
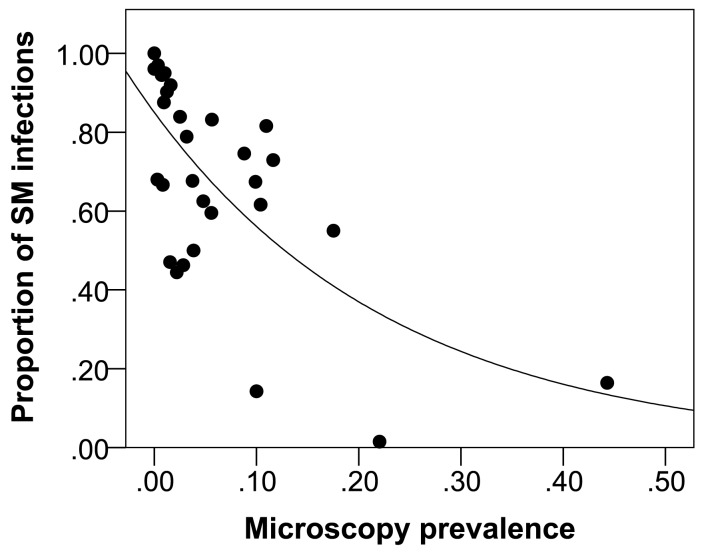
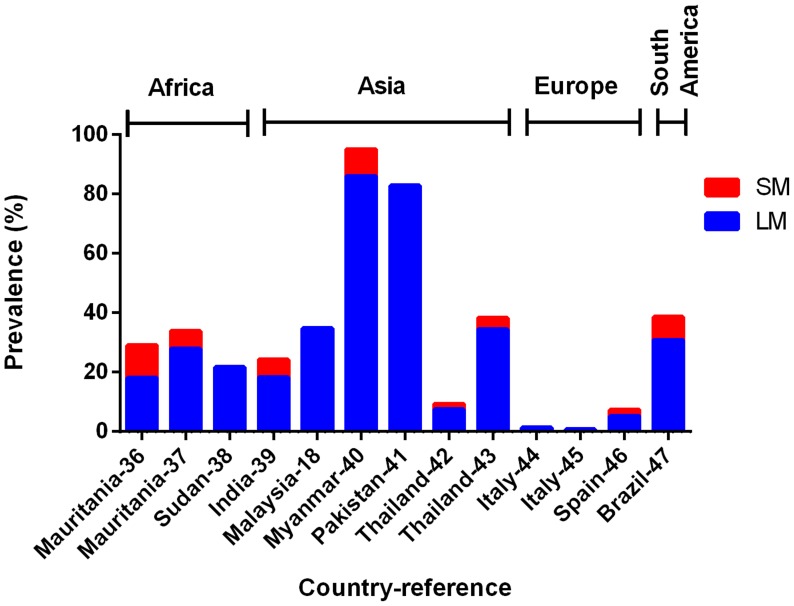
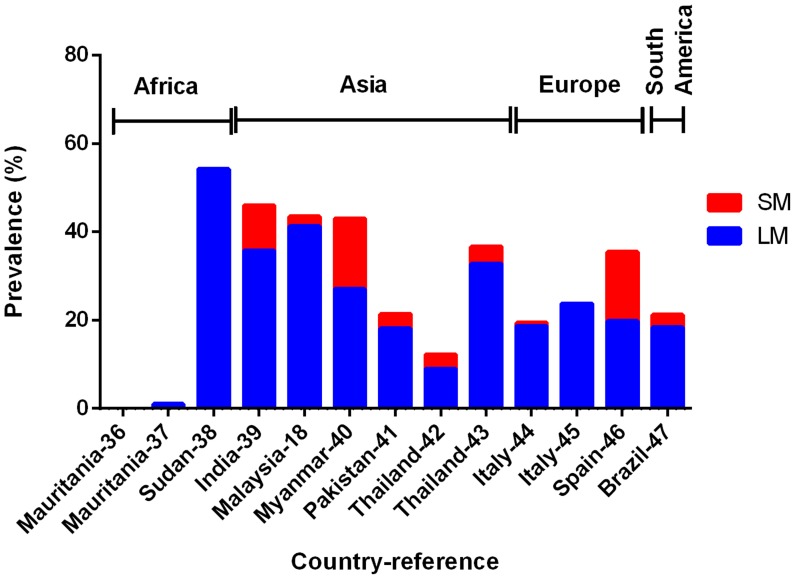
Methodology/principal findings: A systematic search of PubMed was conducted, and results of both light microscopy (LM) and polymerase chain reaction (PCR)-based diagnostic tests for P. vivax from 44 cross-sectional surveys or screening studies of clinical malaria suspects were analysed. Analysis revealed that SM P. vivax is prevalent across different geographic areas with varying transmission intensities. On average, the prevalence of SM P. vivax in cross-sectional surveys was 10.9%, constituting 67.0% of all P. vivax infections detected by PCR. The relative proportion of SM P. vivax is significantly higher than that of the sympatric P. falciparum in these settings. A positive relationship exists between PCR and LM P. vivax prevalence, while there is a negative relationship between the proportion of SM P. vivax and the LM prevalence for P. vivax. Amongst clinical malaria suspects, however, SM P. vivax was not identified.
Conclusions/significance: SM P. vivax is prevalent across different geographic areas, particularly areas with relatively low transmission intensity. Diagnostic tools with sensitivity greater than that of LM are required for detecting these infection reservoirs. In contrast, SM P. vivax is not prevalent in clinical malaria suspects, supporting the recommended use of quality LM and rapid diagnostic tests in clinical case management. These findings enable malaria control and elimination programs to estimate the prevalence and proportion of SM P. vivax infections in their settings, and develop appropriate elimination strategies to tackle SM P. vivax to interrupt transmission.
Conflict of interest statement
The authors have declared that no competing interests exist.
Figures
References
-
- WHO (2013) World Malaria Report 2013. World Health Organization, Geneva.
-
- WHO (2012) Disease surveillance for malaria elimination: an operational manual. World Health Organization, Geneva, Switzerland.
-
- Schneider P, Bousema JT, Gouagna LC, Otieno S, van de Vegte-Bolmer M, et al. (2007) Submicroscopic Plasmodium falciparum gametocyte densities frequently result in mosquito infection. Am J Trop Med Hyg 76: 470–474. - PubMed
-
- Coleman RE, Kumpitak C, Ponlawat A, Maneechai N, Phunkitchar V, et al. (2004) Infectivity of asymptomatic Plasmodium-infected human populations to Anopheles dirus mosquitoes in western Thailand. J Med Entomol 41: 201–208. - PubMed
-
- Okell LC, Ghani AC, Lyons E, Drakeley CJ (2009) Submicroscopic infection in Plasmodium falciparum-endemic populations: a systematic review and meta-analysis. J Infect Dis 200: 1509–1517. - PubMed
Publication types
MeSH terms
Grants and funding
LinkOut - more resources
Full Text Sources
Other Literature Sources
