. 2015 Jan 8;11(1):e1004831.
doi: 10.1371/journal.pgen.1004831. eCollection 2015 Jan.

The global regulatory architecture of transcription during the Caulobacter cell cycle

Affiliations

The global regulatory architecture of transcription during the Caulobacter cell cycle

Bo Zhou et al. PLoS Genet. .

Abstract

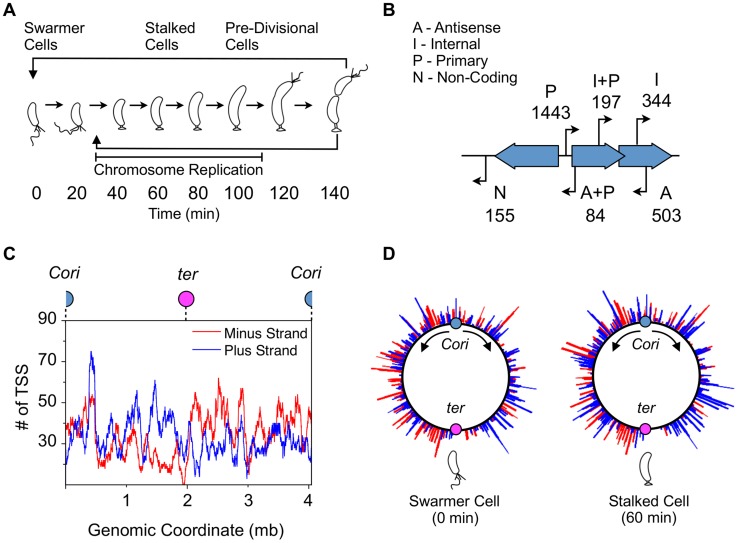
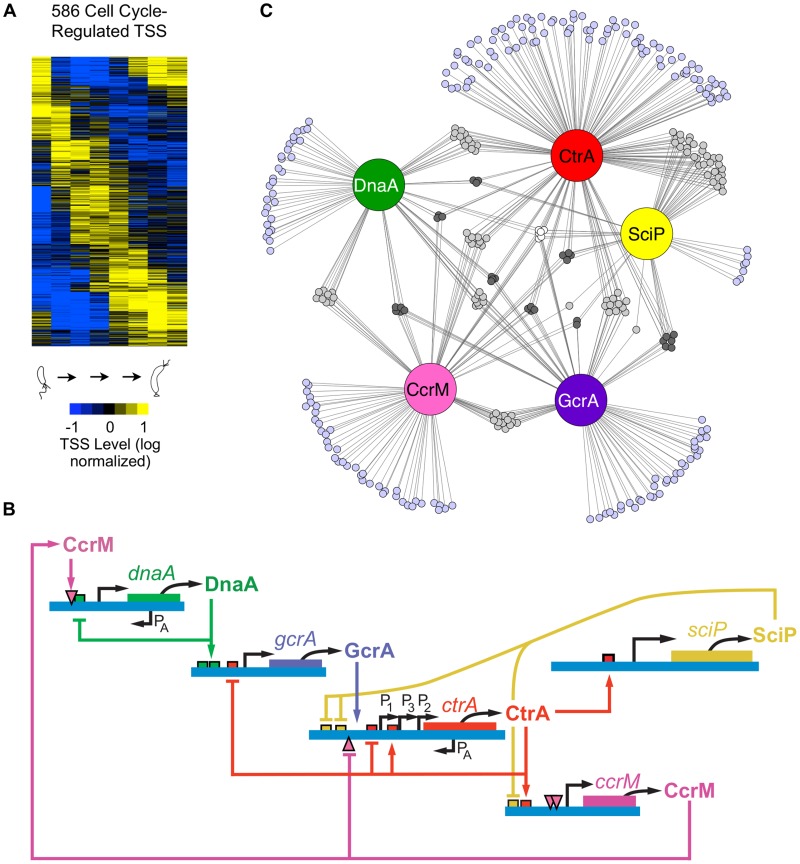
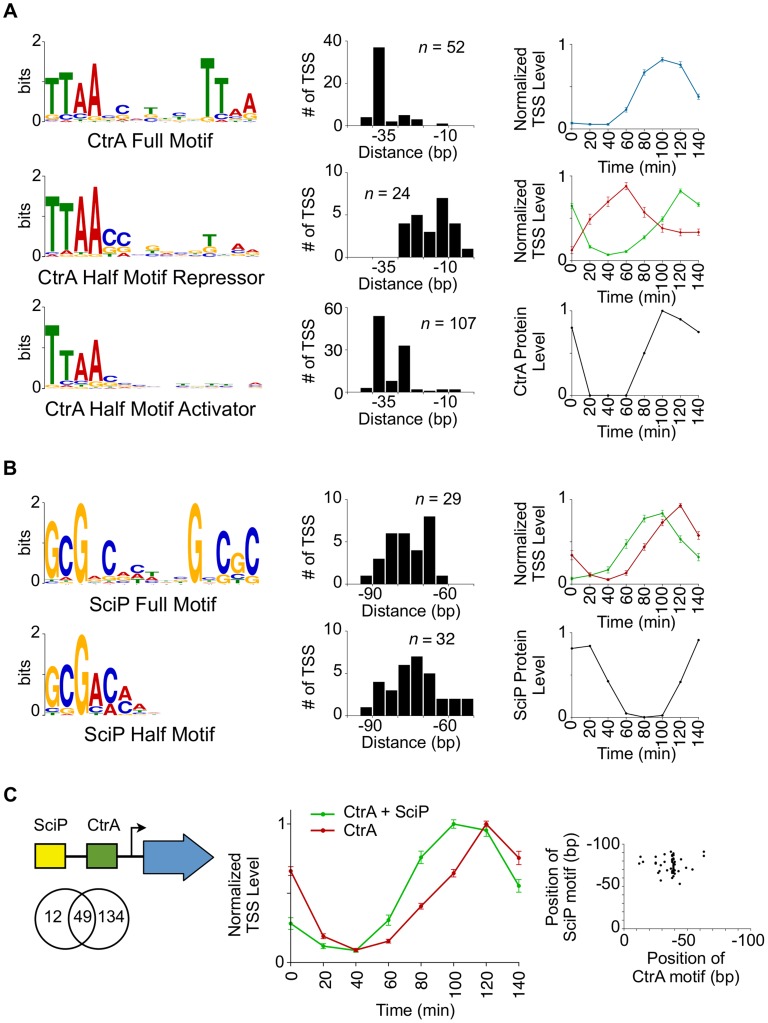
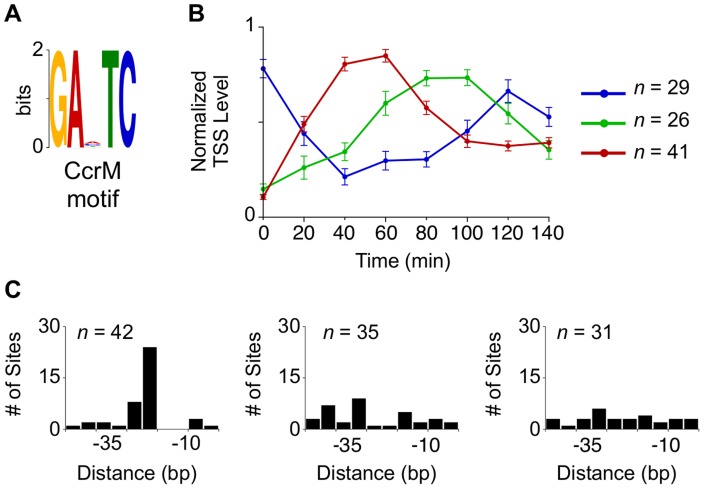
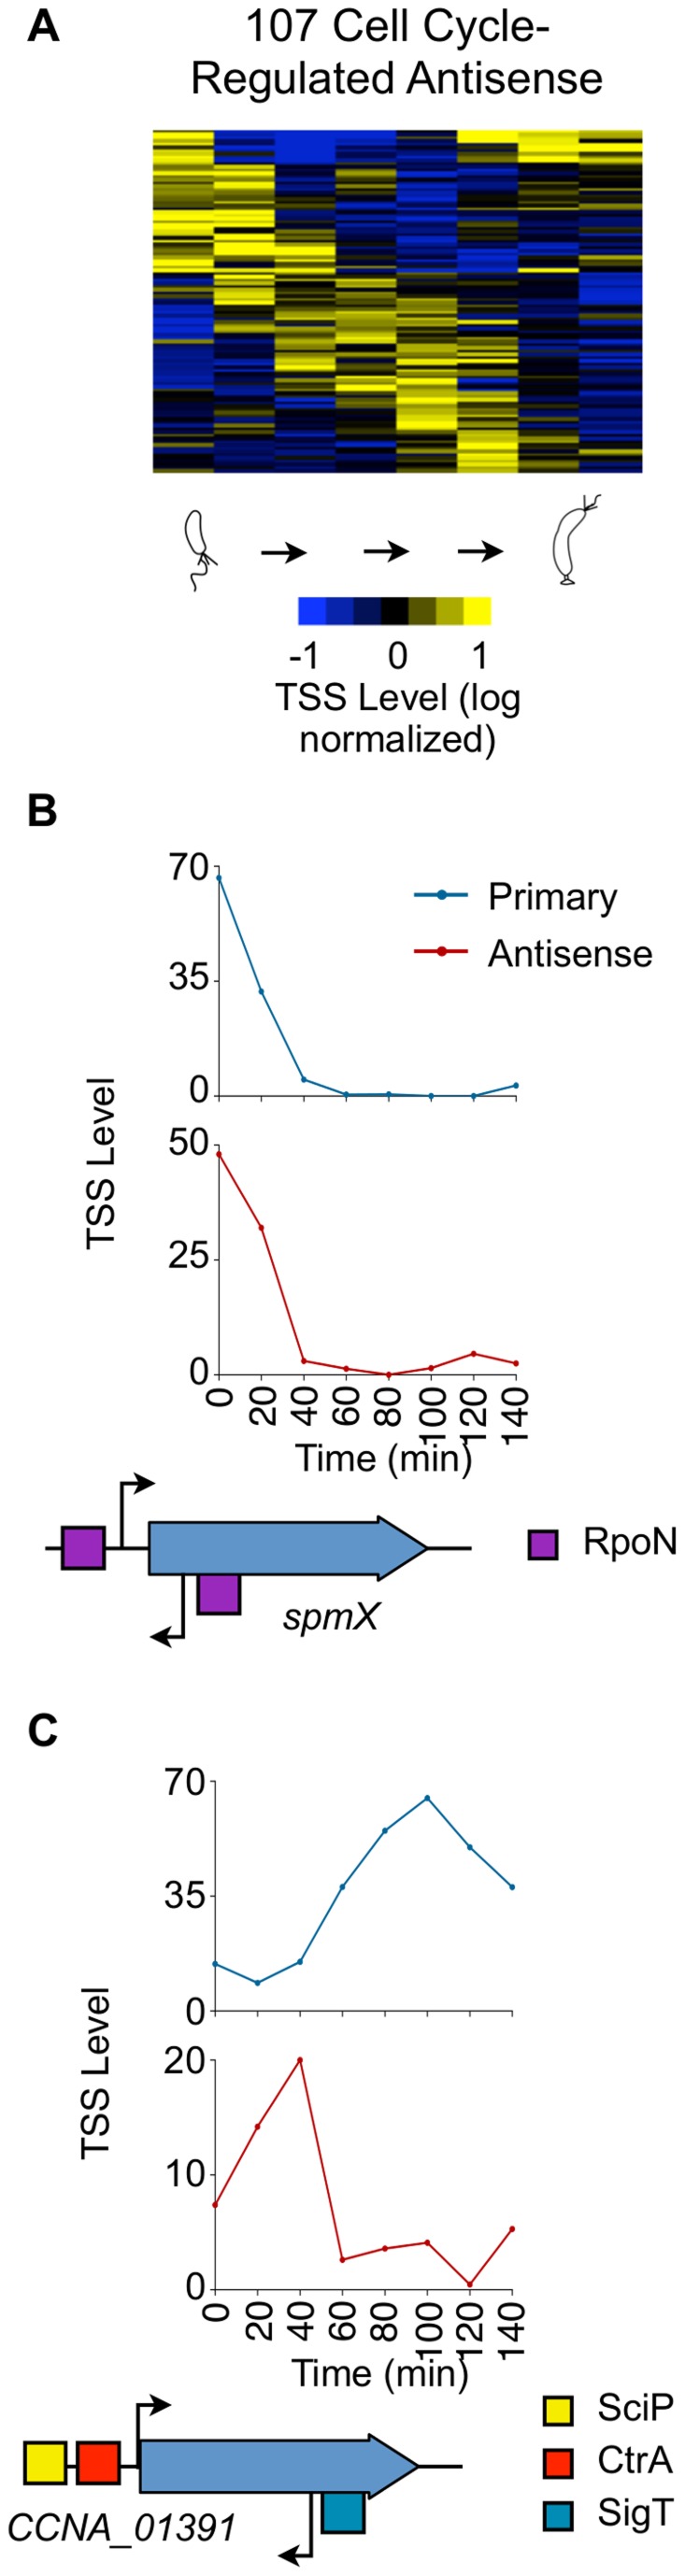
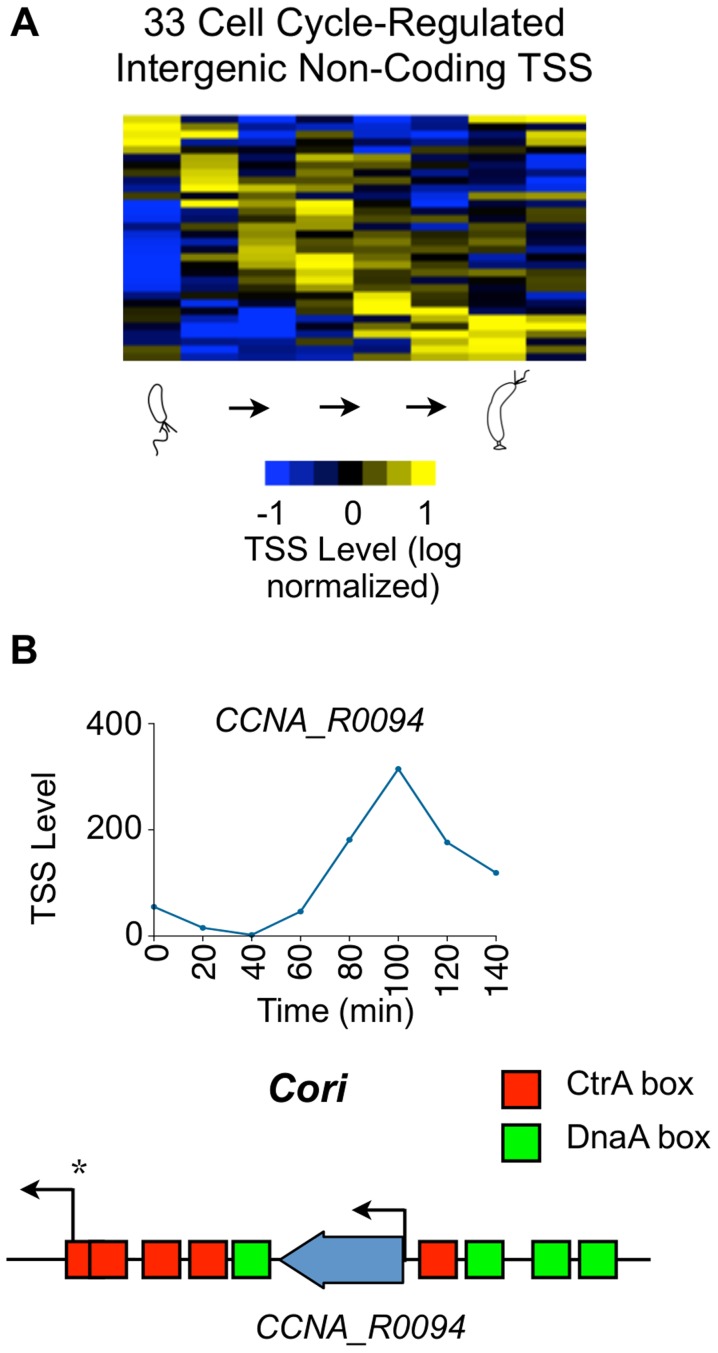
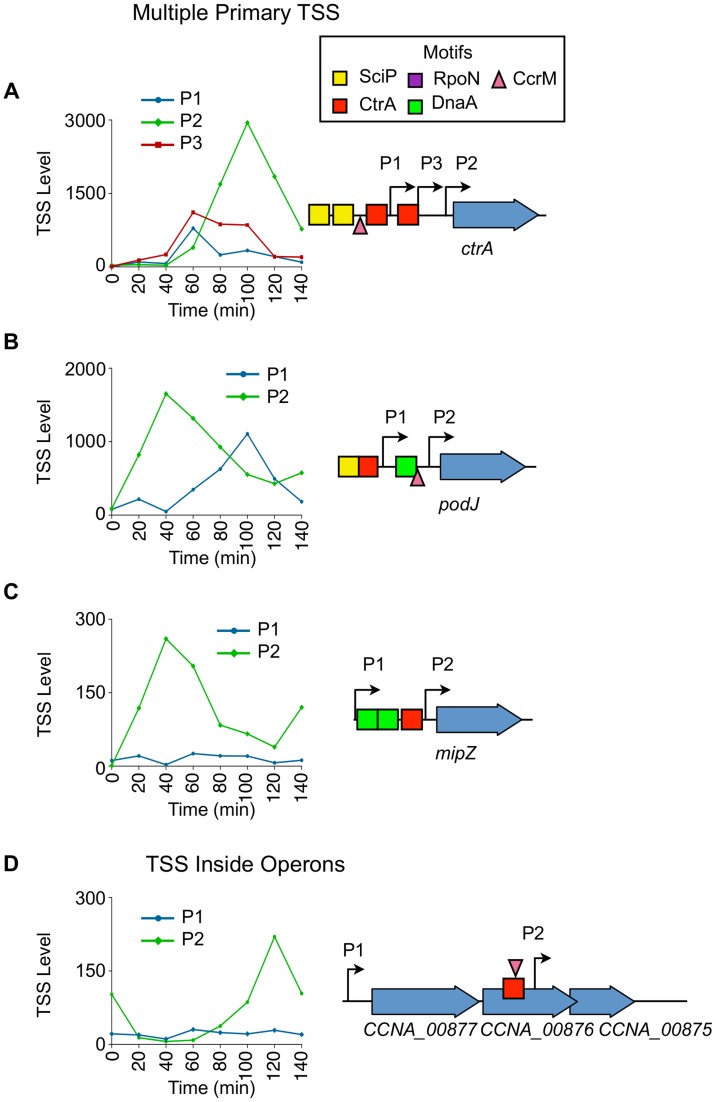
Each Caulobacter cell cycle involves differentiation and an asymmetric cell division driven by a cyclical regulatory circuit comprised of four transcription factors (TFs) and a DNA methyltransferase. Using a modified global 5' RACE protocol, we globally mapped transcription start sites (TSSs) at base-pair resolution, measured their transcription levels at multiple times in the cell cycle, and identified their transcription factor binding sites. Out of 2726 TSSs, 586 were shown to be cell cycle-regulated and we identified 529 binding sites for the cell cycle master regulators. Twenty-three percent of the cell cycle-regulated promoters were found to be under the combinatorial control of two or more of the global regulators. Previously unknown features of the core cell cycle circuit were identified, including 107 antisense TSSs which exhibit cell cycle-control, and 241 genes with multiple TSSs whose transcription levels often exhibited different cell cycle timing. Cumulatively, this study uncovered novel new layers of transcriptional regulation mediating the bacterial cell cycle.


Conflict of interest statement

The authors have declared that no competing interests exist.

Figures

Figure 1
Figure 1. Global identification and organization of TSSs.
(A) The Caulobacter asymmetric cell division cycle yields two distinct cell types: a motile swarmer cell and a sessile stalked cell. Stages of the Caulobacter cell cycle are shown in 20 min intervals, beginning with the swarmer cell at 0 min. Chromosome replication takes place between approximately 30 min and 110 min. TAP treated 5′ RACE sequencing libraries were prepared for each of the 8 time points shown. (B) Categories assigned to 2726 TSS identified based on their genomic context, plus the number of TSS in each category. TSS initiated upstream of CDSs are denoted as primary (P); those initiated in intergenic regions or upstream of annotated RNAs including small non-coding RNAs, ribosomal RNAs, and tRNAs are denoted as non-coding (N); those initiated from within coding sequences are denoted as internal (I), and those initiated within coding sequences but in the opposite direction are denoted as antisense (A). Some TSS fit the criteria for more than one category: primary and antisense (A+P, 84) and between primary and internal (I+P, 197). Many CDSs have multiple TSSs of different categories. (See Methods for specific definition of the categories.) (C) Distribution of TSSs on the genome, plotted as the number of TSSs within a 100kb sliding window. Plus strand: blue; minus strand: red. Blue dot: Caulobacter origin of replication (Cori). Purple dot: terminus (ter). (D) Distribution of TSS levels along the Caulobacter chromosome in swarmer (0 min) and stalked cells (60 min). Normalized number of sequencing reads (log scale) of cell cycle-regulated TSSs are shown. Blue: plus strand. Red: minus strand.
Figure 2
Figure 2. Cell cycle-regulated transcription by combinatorial control of master regulators.
(A) Heat map of transcriptional profiles of the 586 cell cycle-regulated TSSs. Fifteen clusters were generated using the k-means algorithm and ordered according to their maximum time of activation as a function of the cell cycle. Columns correspond to the 8 time points during cell cycle progression shown in Fig. 1A and each row reflects the expression pattern of a single TSS. The TSS expression values are log2 transformed and normalized such that mean  = 0, max  = 1, and min  = −1. (B) The core regulatory circuit that drives the Caulobacter cell cycle. DnaA is required to initiate DNA replication, and it also acts as a transcription factor. The circuit contains transcription factors GcrA, CtrA, and SciP, as well as the DNA methyltransferase CcrM . This core circuit drives cell cycle progression by orderly activation of the expression of 334 cell cycle-regulated TSSs. PA indicates antisense TSSs within dnaA and ctrA. (C) Network of master regulators (DnaA, CtrA, SciP, and CcrM binding motifs or a>3 fold enrichment of GcrA Chip-seq signal [26]) in promoter regions of 334 cell cycle-regulated TSSs. Each promoter is represented by a small circle and each line represents interaction by a corresponding regulatory factors in a large colored circle. Promoters with ≥4 master regulators are white, 3 master regulators are dark grey, 2 master regulators are light grey, and 1 master regulator are light blue.
Figure 3
Figure 3. Coordinated control of CtrA regulated transcription by SciP.
(A) CtrA full motif TTAA-N7-TTAA (n = 52, e-value  = 1.2 e−49) (top left). Histogram to the right represents the distances from which the 5′ nucleotide of the CtrA full motif is positioned relative to the TSS. Normalized TSS levels for the full CtrA motif as a function of the cell cycle (top right). Normalized TSS levels (y-axis) indicates the fraction of reads relative to the maximum obtained during the cell cycle, and error bars represent standard error. Left middle and left bottom graphs show the CtrA half motif, TTAA, enriched in two separate groups that reflect their position relative to the TSS (shown to the right). Normalized TSS activities are shown on the right middle panel in red (CtrA half motif repressor, n = 24, e-value  = 5.2 e−8) and green (CtrA half motif activator, n = 107, e-value  = 4.2 e−141). CtrA protein levels as a function of the cell cycle, normalized from western blots (max  = 1, min  = 0), are shown in the bottom right panel. (B) SciP full motif GCGNC-N5-GNCGC (n = 29, e-value  = 3.5 e−19, top left) and half motif GCGNC (n = 32, e-value  = 3.4 e−6, bottom left) are enriched in two separate groups. Histograms of the SciP full motif (red) and half motif (green) are shown relative to the TSS. The normalized TSS activities as a function of the cell cycle are shown on the right in red (full motif) and green (half motif). Shown in the bottom right, SciP protein levels are normalized from western blots (max  = 1, min  = 0). (C) Representation of relative positions of SciP and CtrA binding motifs (Left); Venn diagram showing the number of TSS with an enriched upstream CtrA motif, SciP motif, or both. Middle panel shows normalized TSS levels as a function of the cell cycle showing CtrA and SciP binding motifs (green) or CtrA only (red). Only TSSs activated by CtrA are included. Error bars are the standard error. Scatter plot of the coincident position of SciP and CtrA binding motifs (bottom right).
Figure 4
Figure 4. Cell cycle-regulated TSSs with upstream CcrM methylation sites.
(A, B) CcrM methylation motif GANTC (n = 108, e-value  = 2.0 e−56) enriched in the promoter regions correspond to three separate groups of TSSs generated by hierarchical clustering with average cell cycle profiles shown in (blue, red, and green). (C) Histogram of the distances in which the CcrM GANTC methylation motif is found relative to the TSS.
Figure 5
Figure 5. Cell cycle-regulated antisense TSSs.
(A) Heat map of transcriptional profiles of the 82 cell cycle-regulated antisense TSSs (A or A+P) k-means clustered and ordered by time of activation. Columns correspond to time points in the cell cycle (0–140 min) in 20 min intervals, and each row denotes a single TSS. All TSS expression values are log2 transformed and normalized such that mean  = 0, max  = 1, and min  = −1. (B, C) Cell-cycle transcriptional profiles of primary (blue) and antisense (red) TSS of spmX and CCNA_01391, respectively. Time (min) is shown on the x-axis. Normalized 5′ RACE sequencing reads shown on y-axis. Locations of TSS as well as SciP (yellow), RpoN (purple), and SigT (blue) binding motifs with respect to the CDS are represented below the x-axis. CCNA_01391 has a SciP binding motif (GCGNC) and a CtrA binding motif (TTAT-N7-TCAA) at −79 and −32 of its leaderless primary TSS respectively. There is a SigT binding motif (GGAAC-N16-TGCT) at −34 of the CCNA_01391 antisense TSS. The gene spmX has a RpoN binding motif (GGCNC-N4-CTTGC) at −26 bp relative of its primary TSS and another putative RpoN binding motif (CGCAC-N4-CTTGC) at −24 relative to its antisense TSS.
Figure 6
Figure 6. Cell cycle-regulated intergenic non-coding TSSs.
(A) Heat map of transcriptional profiles of the 33 cell cycle-regulated intergenic non-coding TSS clustered (using k-means clustering algorithm) and ordered by time of activation. Columns correspond to time points as a synchronized culture progresses from swarmer cell (0 min) to cell division (140 mins) in 20 min intervals, and each row denotes a single TSS. All TSS expression values are log2 transformed and normalized such that mean  = 0, max  = 1, and min  = −1. (B) Cell cycle profile of the TSS of ncRNA gene CCNA_R0094 in terms of the normalized 5′ RACE reads vs time. CCNA_R0094 is transcribed from within the chromosomal origin region (Cori). Locations of the CtrA (red) and DnaA (green) binding boxes as reported by are shown. Transcription from the promoter denoted by * is essential for chromosome replication .
Figure 7
Figure 7. Cell cycle-regulation of genes with multiple upstream TSSs.
(A) Cell-cycle profile of the 3 cell cycle-regulated TSSs (P1, P2, P3) upstream of ctrA. Time (min) is shown on the x-axis. Normalized 5′ RACE reads shown on y-axis. P1 in blue, P2 in green, and P3 in red. Locations of P1, P2, and P3 with respect to the CDS is shown on the right. The CcrM methylation site GANTC (▾) is located at −29 of P1. The CtrA half motif repressor TTAA (red box) is located at −14 of P1, and the second CtrA binding motif TTAA-N7-TTAA is located at -39 of P2 and at −14 of P3. Two SciP half binding motifs GCGNC (yellow boxes) located −78 of P1 and −74 of P3. (B, C) Cell-cycle profiles of multiple TSS upstream of podJ and mipZ. P1 plotted in blue, and P2 plotted in green. Time is shown on the x-axis.; normalized 5′ RACE reads on the y-axis. The location of P1 and P2 with respected to the CDS is represented on the right. Both P1 and P2 of podJ are cell cycle-regulated. CcrM methylation sites GANTC (▾) located at −24 of podJ P2. P2 of mipZ is cell cycle-regulated. There is a CtrA full motif TTAA-N6-TTAA at −49 of podJ P1 and a CtrA half motif repressor TTAA at −10 of mipZ P2. A SciP binding motif GCGAC is located at −72 of podJ P1. DnaA binding motifs (green boxes) CTCCACA, ATCCACA, and GTCCACA at −82 of podJ P2 and −52 and −83 of mipZ P2 respectively. (D) Cell-cycle profiles of TSS upstream (P1) and inside (P2) the operon consisting of CCNA_00877, CCNA_00876, and CCNA_00875. Time (min) is shown on the x-axis. Normalized 5′ RACE reads shown on y-axis. The location of P1 and P2 with respected to the CDS is represented on the left. P2 is cell cycle-regulated, and there is a CcrM methylation site GANTC (▾) at −35 of P2. There is a CtrA binding motif (TTAC-N7-TTCA) at -39 of P2 inside CCNA_00876.

References

    1. McAdams HH, Shapiro L (2009) System-level design of bacterial cell cycle control. FEBS Lett 583: 3984–3991. - PMC - PubMed
    1. McAdams HH, Shapiro L (2011) The architecture and conservation pattern of whole-cell control circuitry. J Mol Biol 409: 28–35. - PMC - PubMed
    1. Collier J (2012) Regulation of chromosomal replication in Caulobacter crescentus . Plasmid 67: 76–87. - PubMed
    1. McAdams HH, Shapiro L (2003) A bacterial cell-cycle regulatory network operating in time and space. Science 301: 1874–1877. - PubMed
    1. Kirkpatrick CL, Viollier PH (2012) Decoding Caulobacter development . FEMS Microbiol Rev 36: 193–205. - PubMed

Publication types

MeSH terms

Substances