. 2015 Jan 7;85(1):49-59.
doi: 10.1016/j.neuron.2014.12.028.

Cell lineage analysis in human brain using endogenous retroelements

Affiliations

Cell lineage analysis in human brain using endogenous retroelements

Gilad D Evrony et al. Neuron. .

Abstract

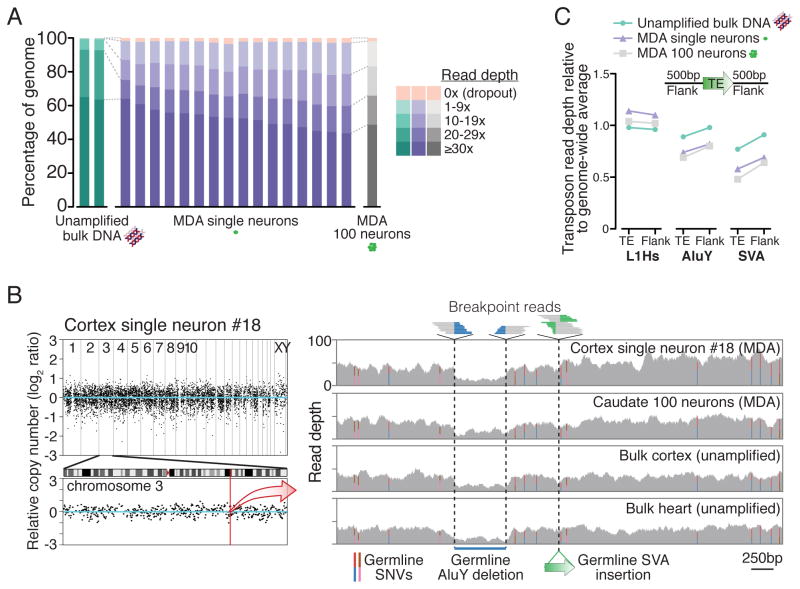
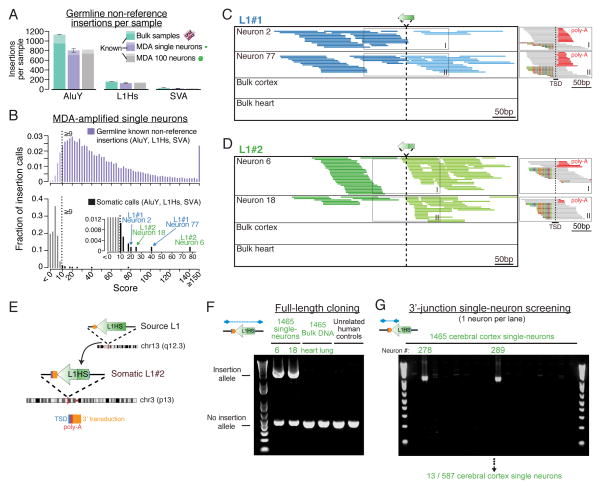
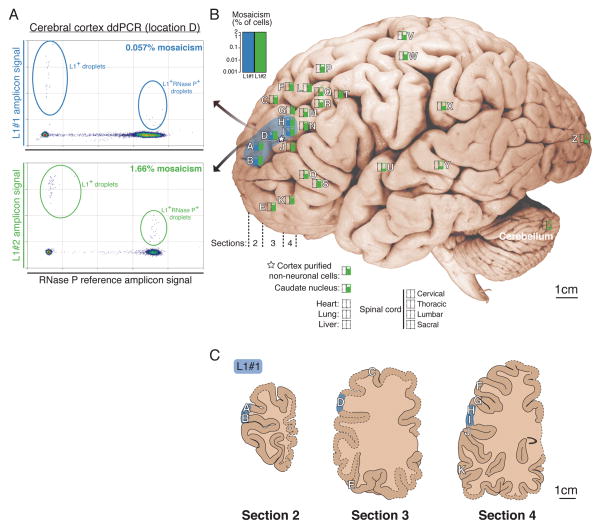
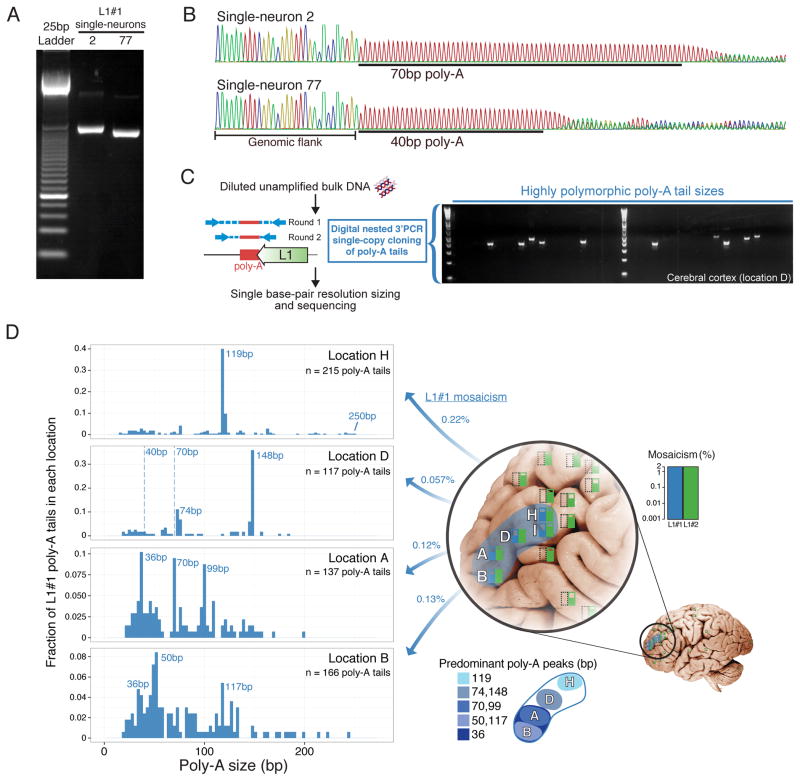
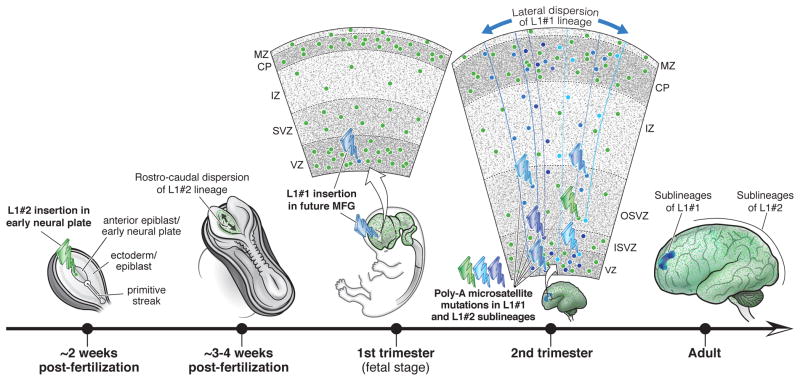
Somatic mutations occur during brain development and are increasingly implicated as a cause of neurogenetic disease. However, the patterns in which somatic mutations distribute in the human brain are unknown. We used high-coverage whole-genome sequencing of single neurons from a normal individual to identify spontaneous somatic mutations as clonal marks to track cell lineages in human brain. Somatic mutation analyses in >30 locations throughout the nervous system identified multiple lineages and sublineages of cells marked by different LINE-1 (L1) retrotransposition events and subsequent mutation of poly-A microsatellites within L1. One clone contained thousands of cells limited to the left middle frontal gyrus, whereas a second distinct clone contained millions of cells distributed over the entire left hemisphere. These patterns mirror known somatic mutation disorders of brain development and suggest that focally distributed mutations are also prevalent in normal brains. Single-cell analysis of somatic mutation enables tracing of cell lineage clones in human brain.


Figures

Figure 1
Figure 1. Single-neuron WGS genome coverage
(A) Percentage of genome covered at specified read depths for all samples in this study. (B) Representative genome-wide coverage plot of single neuron #18 in ~500kb bins, with enlargement of chromosome 3 in which L1#2 was identified (Figure 2). See Figure S5 for plots of all samples. Right panel zoom of a 5kb region (chr3:147,605,344–147,610,345; hg19) shows single-neuron WGS simultaneous detection of 3 types of germline mutations, all concordant with 100-neuron and bulk samples: single nucleotide variants (SNVs, colored bars represent ratios of allele reads), a deletion (578bp AluY and additional flanking sequence), and an SVA retrotransposon insertion. All mutations have been previously identified in public polymorphism databases. (C) Average read depth of retrotransposon insertions annotated in the human genome reference and their 500bp flanks, relative to the genome-wide average read depth. Relative read depths correlate with average GC-content of each retrotransposon family (L1Hs: 42%; AluY: 54%; SVA: 63% GC content), due to GC amplification bias of MDA (see Table S2 and Supplemental Note 1). See also Figures S1–S9 and Tables S1–S2.
Figure 2
Figure 2. Single-neuron WGS analysis identifies somatic retrotransposon insertions
(A) Average number of germline non-reference insertions (i.e. present in either bulk cortex or heart) detected per sample with an scTea-calculated score ≥9 (see Supplemental Experimental Procedures for details on score calculation). Error bars (SD). The number of ‘known’ insertions (reported in public databases and prior population studies of retrotransposon polymorphism) are shaded in darker color. (B) Score distribution of all AluY, L1Hs, and SVA germline known non-reference insertions (upper panel, n=13,849 insertions) and somatic calls (lower panel, i.e. calls absent in bulk heart) detected across all 16 single neurons. Dashed line indicates score threshold ≥9 used to call somatic candidates, with bars below threshold drawn in lighter color. Note the distribution of known insertions at higher scores compared to somatic calls at lower scores that arise from low-level MDA chimeras below threshold. (C) Whole-genome sequencing reads detecting L1#1. Main panel shows fully-aligned reads whose pairs aligned to L1, with darker and lighter colors indicating plus and minus orientations, respectively. Smaller panels on right show partially-aligned (breakpoint) reads spanning the insertion breakpoint, detecting the TSD and poly-A tail. Mismatched bases relative to the human genome reference are colored. (D) Whole-genome sequencing reads detecting L1#2. A few partially-aligned reads distant from the insertion site are chimeras. (E) Schematic of L1#2 and its source L1. (F) Full-length PCR validation and cloning of L1#2. (G) Representative gel from a 3′PCR screen for L1#2 in single neurons. See also Figures S10–S12 and Table S3.
Figure 3
Figure 3. Mosaicism of somatic L1 insertions measured by ddPCR
(A) Representative ddPCR plots of L1#1 and L1#2. L1+ droplets are plotted with larger points for better visualization. Reduced L1 signal in double-positive versus single-positive droplets is due to relatively higher PCR efficiency of RNaseP amplicons. (B) Mosaicism levels measured in individual UMB1465, plotted on a representative brain, using logarithmic box plots to indicate level of mosaicism. Empty rectangles indicate no detection. Blue shading indicates the estimated distribution of L1#1 in the middle frontal gyrus. The 16 WGS single neurons were originally obtained from location D (underlined). (C) Lucida tracings of cortex sections 2, 3, and 4 in which L1#1 was found, traced from photographs of sections. Dashed lines indicate regions that were not present in photographs of sections due to sampling prior to this study. Anatomy of these regions was extrapolated based on records of sampled locations, adjacent sections, photographs of right hemisphere formalin-fixed sections, and atlases of normal brain anatomy. Locations in which L1#1 was detected are highlighted in blue. See Figure S14 for diagrams of all sampled brain sections. See also Figures S13–S15 and Table S4.
Figure 4
Figure 4. Somatic retrotransposon insertion poly-A tail polymorphism reveals sub-lineages across brain regions
(A) L1#1 3′PCR products differ in size between single-neurons 2 and 77. (B) Sanger sequencing of L1#1 in single neurons 2 and 77 reveals poly-A tail polymorphism. (C) Brief schematic of dnPCR single-copy cloning of poly-A tails directly from unamplified bulk DNA, and a representative gel showing highly polymorphic product sizes. Poly-A tail lengths were precisely measured by capillary electrophoresis. (D) L1#1 poly-A tail size distributions (in 3 bp bins) obtained by dnPCR shows peaks representing sub-lineages and marked variability within and between locations. Dashed lines mark poly-A tail sizes of single-neurons 2 and 77 sorted from location D. Location I not shown, since due to extremely low mosaicism only 4 poly-A tails were cloned. See also Figures S16–S19 and Table S5.
Figure 5
Figure 5. Developmental model of mutation events and lineages in this study
L1#1 is illustrated as occurring in the 1st trimester, though its exact timing is unknown. MFG, middle frontal gyrus; VZ; SVZ, subventricular zone; ISVZ, inner SVZ; OSVZ, outer SVZ; IZ, intermediate zone; CP, cortical plate; MZ, marginal zone.

References

    1. Baillie JK, Barnett MW, Upton KR, Gerhardt DJ, Richmond TA, De Sapio F, Brennan PM, Rizzu P, Smith S, Fell M, et al. Somatic retrotransposition alters the genetic landscape of the human brain. Nature. 2011;479:534–537. - PMC - PubMed
    1. Bienko M, Crosetto N, Teytelman L, Klemm S, Itzkovitz S, van Oudenaarden A. A versatile genome-scale PCR-based pipeline for high-definition DNA FISH. Nat Methods. 2013;10:122–124. - PMC - PubMed
    1. Blainey PC, Quake SR. Dissecting genomic diversity, one cell at a time. Nat Methods. 2014;11:19–21. - PMC - PubMed
    1. Brouha B, Schustak J, Badge RM, Lutz-Prigge S, Farley AH, Moran JV, Kazazian HH., Jr Hot L1s account for the bulk of retrotransposition in the human population. Proc Natl Acad Sci USA. 2003;100:5280–5285. - PMC - PubMed
    1. Cai X, Evrony GD, Lehmann HS, Elhosary PC, Mehta BK, Poduri A, Walsh CA. Single-Cell, Genome-wide Sequencing Identifies Clonal Somatic Copy-Number Variation in the Human Brain. Cell reports. 2014;8:1280–1289. - PMC - PubMed

Publication types

MeSH terms