

Transmitted virus fitness and host T cell responses collectively define divergent infection outcomes in two HIV-1 recipients
- PMID: 25569444
- PMCID: PMC4287535
- DOI: 10.1371/journal.ppat.1004565
Transmitted virus fitness and host T cell responses collectively define divergent infection outcomes in two HIV-1 recipients
Abstract
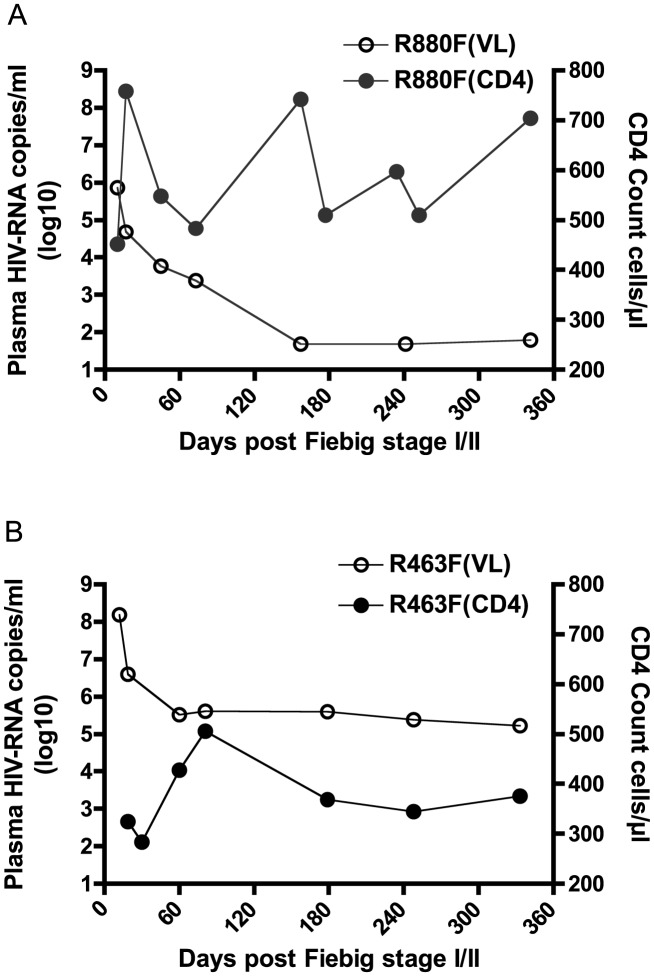
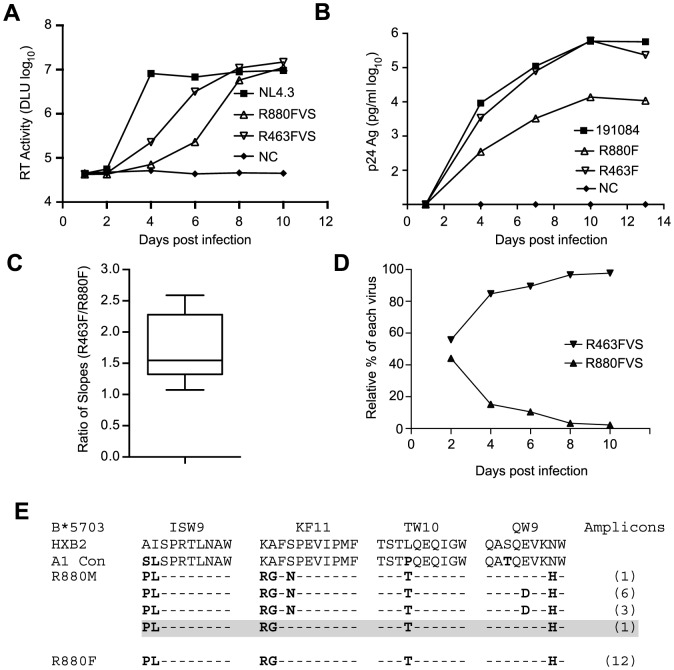
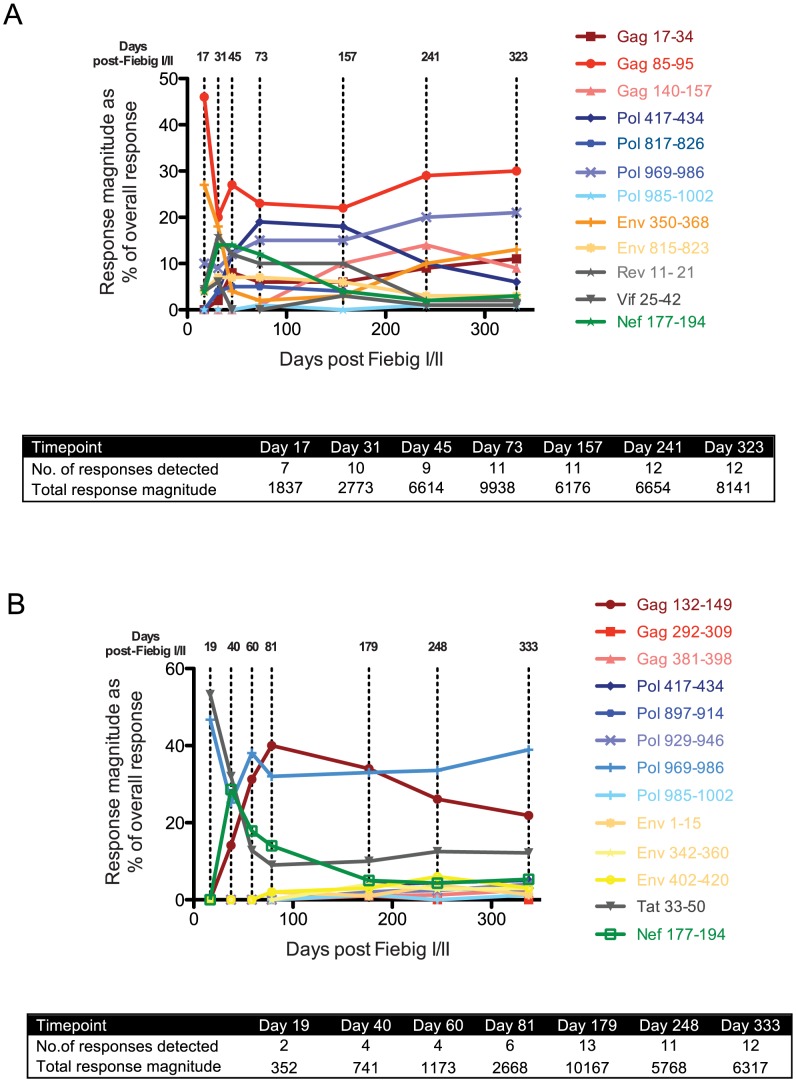
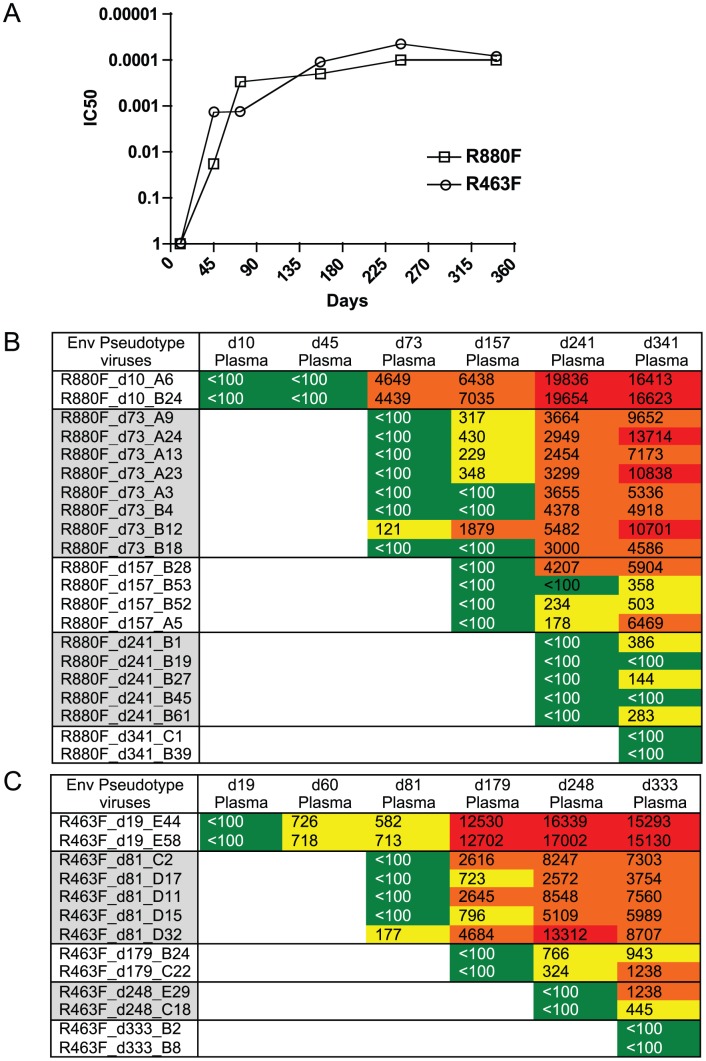
Control of virus replication in HIV-1 infection is critical to delaying disease progression. While cellular immune responses are a key determinant of control, relatively little is known about the contribution of the infecting virus to this process. To gain insight into this interplay between virus and host in viral control, we conducted a detailed analysis of two heterosexual HIV-1 subtype A transmission pairs in which female recipients sharing three HLA class I alleles exhibited contrasting clinical outcomes: R880F controlled virus replication while R463F experienced high viral loads and rapid disease progression. Near full-length single genome amplification defined the infecting transmitted/founder (T/F) virus proteome and subsequent sequence evolution over the first year of infection for both acutely infected recipients. T/F virus replicative capacities were compared in vitro, while the development of the earliest cellular immune response was defined using autologous virus sequence-based peptides. The R880F T/F virus replicated significantly slower in vitro than that transmitted to R463F. While neutralizing antibody responses were similar in both subjects, during acute infection R880F mounted a broad T cell response, the most dominant components of which targeted epitopes from which escape was limited. In contrast, the primary HIV-specific T cell response in R463F was focused on just two epitopes, one of which rapidly escaped. This comprehensive study highlights both the importance of the contribution of the lower replication capacity of the transmitted/founder virus and an associated induction of a broad primary HIV-specific T cell response, which was not undermined by rapid epitope escape, to long-term viral control in HIV-1 infection. It underscores the importance of the earliest CD8 T cell response targeting regions of the virus proteome that cannot mutate without a high fitness cost, further emphasizing the need for vaccines that elicit a breadth of T cell responses to conserved viral epitopes.
Conflict of interest statement
The authors have declared that no competing interests exist.
Figures
References
-
- Buchbinder SP, Katz MH, Hessol NA, O'Malley PM, Holmberg SD (1994) Long-term HIV-1 infection without immunologic progression. AIDS 8: 1123–1128. - PubMed
-
- Mellors JW, Kingsley LA, Rinaldo CR Jr, Todd JA, Hoo BS, et al. (1995) Quantitation of HIV-1 RNA in plasma predicts outcome after seroconversion. Annals of internal medicine 122: 573–579. - PubMed
-
- Cao Y, Qin L, Zhang L, Safrit J, Ho DD (1995) Virologic and immunologic characterization of long-term survivors of human immunodeficiency virus type 1 infection. The New England journal of medicine 332: 201–208. - PubMed
-
- Deeks SG, Walker BD (2007) Human immunodeficiency virus controllers: mechanisms of durable virus control in the absence of antiretroviral therapy. Immunity 27: 406–416. - PubMed
Publication types
MeSH terms
Substances
Associated data
- Actions
- Actions
- Actions
- Actions
- Actions
- Actions
- Actions
- Actions
- Actions
- Actions
- Actions
- Actions
- Actions
- Actions
- Actions
- Actions
- Actions
- Actions
- Actions
- Actions
- Actions
- Actions
- Actions
- Actions
- Actions
- Actions
- Actions
- Actions
- Actions
- Actions
- Actions
- Actions
- Actions
- Actions
- Actions
- Actions
- Actions
- Actions
- Actions
- Actions
- Actions
- Actions
- Actions
- Actions
- Actions
- Actions
- Actions
- Actions
- Actions
- Actions
- Actions
- Actions
- Actions
- Actions
- Actions
- Actions
- Actions
- Actions
- Actions
- Actions
- Actions
- Actions
- Actions
- Actions
- Actions
- Actions
- Actions
- Actions
- Actions
- Actions
- Actions
- Actions
- Actions
- Actions
- Actions
- Actions
- Actions
- Actions
- Actions
- Actions
- Actions
- Actions
- Actions
- Actions
- Actions
- Actions
- Actions
- Actions
- Actions
- Actions
- Actions
- Actions
- Actions
- Actions
- Actions
- Actions
- Actions
- Actions
- Actions
- Actions
- Actions
- Actions
- Actions
- Actions
- Actions
- Actions
- Actions
- Actions
- Actions
- Actions
- Actions
- Actions
- Actions
- Actions
- Actions
- Actions
- Actions
- Actions
- Actions
- Actions
- Actions
- Actions
- Actions
- Actions
- Actions
- Actions
- Actions
- Actions
- Actions
- Actions
- Actions
- Actions
- Actions
Grants and funding
- R01 OD011095/OD/NIH HHS/United States
- P30 AI050409/AI/NIAID NIH HHS/United States
- UM1 AI100645/AI/NIAID NIH HHS/United States
- P51 OD011132/OD/NIH HHS/United States
- P51OD11132/OD/NIH HHS/United States
- R01 AI058706/AI/NIAID NIH HHS/United States
- R01 AI64060/AI/NIAID NIH HHS/United States
- 2P51RR000165-51/RR/NCRR NIH HHS/United States
- R01-AI028433/AI/NIAID NIH HHS/United States
- P51RR165/RR/NCRR NIH HHS/United States
- R37 AI51231/AI/NIAID NIH HHS/United States
- P30 AI045008/AI/NIAID NIH HHS/United States
- P51 RR000165/RR/NCRR NIH HHS/United States
- R01-OD011095/OD/NIH HHS/United States
- R01 AI028433/AI/NIAID NIH HHS/United States
- R37 AI051231/AI/NIAID NIH HHS/United States
- R01 AI064060/AI/NIAID NIH HHS/United States
- UM1-AI100645/AI/NIAID NIH HHS/United States
LinkOut - more resources
Full Text Sources
Other Literature Sources
Medical
Research Materials
Miscellaneous
