

Using modelling to disentangle the relative contributions of zoonotic and anthroponotic transmission: the case of lassa fever
- PMID: 25569707
- PMCID: PMC4288732
- DOI: 10.1371/journal.pntd.0003398
Using modelling to disentangle the relative contributions of zoonotic and anthroponotic transmission: the case of lassa fever
Abstract
Background: Zoonotic infections, which transmit from animals to humans, form the majority of new human pathogens. Following zoonotic transmission, the pathogen may already have, or may acquire, the ability to transmit from human to human. With infections such as Lassa fever (LF), an often fatal, rodent-borne, hemorrhagic fever common in areas of West Africa, rodent-to-rodent, rodent-to-human, human-to-human and even human-to-rodent transmission patterns are possible. Indeed, large hospital-related outbreaks have been reported. Estimating the proportion of transmission due to human-to-human routes and related patterns (e.g. existence of super-spreaders), in these scenarios is challenging, but essential for planned interventions.
Methodology/principal findings: Here, we make use of an innovative modeling approach to analyze data from published outbreaks and the number of LF hospitalized patients to Kenema Government Hospital in Sierra Leone to estimate the likely contribution of human-to-human transmission. The analyses show that almost [Formula: see text] of the cases at KGH are secondary cases arising from human-to-human transmission. However, we found much of this transmission is associated with a disproportionally large impact of a few individuals ('super-spreaders'), as we found only [Formula: see text] of human cases result in an effective reproduction number (i.e. the average number of secondary cases per infectious case) [Formula: see text], with a maximum value up to [Formula: see text].
Conclusions/significance: This work explains the discrepancy between the sizes of reported LF outbreaks and a clinical perception that human-to-human transmission is low. Future assessment of risks of LF and infection control guidelines should take into account the potentially large impact of super-spreaders in human-to-human transmission. Our work highlights several neglected topics in LF research, the occurrence and nature of super-spreading events and aspects of social behavior in transmission and detection.
Conflict of interest statement
RFG is affiliated with Zalgen Labs. This does not alter our adherence to all PLOS NTDs policies on sharing data and materials. All other authors have no competing interests.
Figures
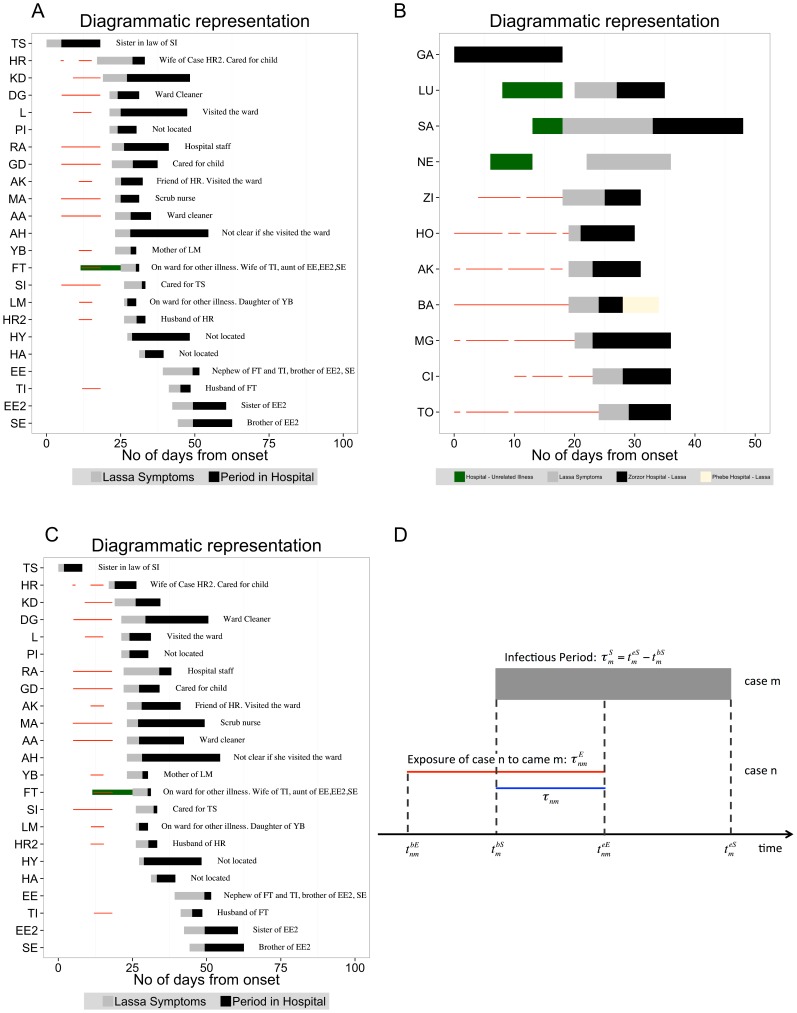
 days), showing period of illness and interrelation among patients . The horizontal bars represent each patient. The x-axis is the time expressed in days from the start of the outbreak, when TS developed the illness (thus time
  in the calculation corresponds to
  December 1969). The grey portion of the bars are the period between the onset of the symptoms and admission to hospital; the black portion of the bars are the period between admission to hospital and discharge/death of the patients; the red thin lines are the period of exposure to the index case TS. The green bar represent the time when the patient was at the ward for unrelated illness. Note, the same diagram in present an extra case, JT, which is not included here. This case refers to Dr. Jeanette M. Troup one of the first scientists working on Lassa Fever Virus, who contracted the disease from an autopsy accident incurred during examination of one of the fatal cases. B: Diagrammatic representation of LF cases admitted at Zorzor Hospital (total duration of the outbreak
  days), Liberia, showing period of illness and interrelation among patients . C: As in Fig. 1.A, but the periods of illness (symptoms plus time at hospital) are randomly permuted. The contact network is kept the same. D: An example of how the time
  was calculated. In this particular case
  if
if  and
and  otherwise, where
  is the time when case
  is no longer exposed to case
  .
.
 of April
  to the
  of January
  , .
, .
 for the nosocomial outbreak described in based on the
  permutations of the duration of illness. It shows the first and third percentiles, the minimum and maximum values, the median, and outliers (red dots). The dashed line represents the case when the effective reproduction number is equal to
  . A: nosocomial outbreak in Jos . B: nosocomial outbreak in Zorzor . C: Distribution of generation time for the two nosocomial outbreaks. The statistics are based on the
  permutations of the duration of illness. D: Distribution of generation time for extra-nosocomial cases. The statistics are based on the
  permutations of the duration of illness.
 and its daily mean,
  , for the KGH epidemic curve vs the proportion
  of cases due to human-to-human transmission (blue line). The shaded grey area covers the range between the
  and
and  percentiles in
  and/or
  ; the dashed red line represents the mean, nosocomial, effective reproduction number. A and B:
  and
and  based on the full networks (in Jos and in Zorzor) of nosocomial cases;
  days. C and D:
  and
and  based on the extra-nosocomial cases in Jos;
  days.
days.
 for both nosocomial outbreaks, based on the
  permutations of the duration of illness. Mean value of the joint data:
  , median:
  , maximum:
  , proportion of cases when
  :
:  , proportion of cases when
  :
:  . B: Distribution of the effective reproduction number for cases of hospitalized patients in KGH for different values of the contribution of human-to-human transmission,
  , the corresponding data for the extra-nosocomial (
 permutation based on
  ,
,  ,
,  ,
,  ,
,  cases in Jos) and all nosocomial outbreaks (based on all Jos and Zorzor cases) are also shown. C: Distribution of the total effective reproduction number, i.e. the average number of cases during the entire duration of the epidemic for different values the contribution of human-to-human transmission,
  .
.
 is greater than one. (i.e. the ratio of the cardinalities of
  and
and  , where
  is set of all simulated
  and
and  the subset of cases when
  is greater than one). B: the expected, relative number of cases generated by this proportion. (i.e. the fraction of the areas of
  )
)References
-
- Carey D, Kemp G, White H, Pinneo L, Addy R, et al. (1972) Lassa fever epidemiological aspects of the 1970 epidemic, Jos, Nigeria. Transactions of the Royal Society of Tropical Medicine and Hygiene 66: 402–408. - PubMed
-
- Monath TP, Mertens PE, Patton R, Moser CR, Baum JJ, et al. (1973) A hospital epidemic of Lassa fever in Zorzor, Liberia, March–April 1972. The American Journal of Tropical Medicine and Hygiene 22: 773–9. - PubMed
-
- Frame JD, Baldwin JM, Gocke DJ, Troup JM (1970) Lassa fever, a new virus disease of man from West Africa. I. Clinical description and pathological findings. The American Journal of Tropical Medicine and Hygiene 19: 670–6. - PubMed
-
- Rose J (1957) An outbreak of encephalomyelitis in Sierra Leone. The Lancet 270: 914–916. - PubMed
Publication types
MeSH terms
Grants and funding
LinkOut - more resources
Full Text Sources
Other Literature Sources
Medical
