Bayesian history matching of complex infectious disease models using emulation: a tutorial and a case study on HIV in Uganda
- PMID: 25569850
- PMCID: PMC4288726
- DOI: 10.1371/journal.pcbi.1003968
Bayesian history matching of complex infectious disease models using emulation: a tutorial and a case study on HIV in Uganda
Abstract
Advances in scientific computing have allowed the development of complex models that are being routinely applied to problems in disease epidemiology, public health and decision making. The utility of these models depends in part on how well they can reproduce empirical data. However, fitting such models to real world data is greatly hindered both by large numbers of input and output parameters, and by long run times, such that many modelling studies lack a formal calibration methodology. We present a novel method that has the potential to improve the calibration of complex infectious disease models (hereafter called simulators). We present this in the form of a tutorial and a case study where we history match a dynamic, event-driven, individual-based stochastic HIV simulator, using extensive demographic, behavioural and epidemiological data available from Uganda. The tutorial describes history matching and emulation. History matching is an iterative procedure that reduces the simulator's input space by identifying and discarding areas that are unlikely to provide a good match to the empirical data. History matching relies on the computational efficiency of a Bayesian representation of the simulator, known as an emulator. Emulators mimic the simulator's behaviour, but are often several orders of magnitude faster to evaluate. In the case study, we use a 22 input simulator, fitting its 18 outputs simultaneously. After 9 iterations of history matching, a non-implausible region of the simulator input space was identified that was 10(11) times smaller than the original input space. Simulator evaluations made within this region were found to have a 65% probability of fitting all 18 outputs. History matching and emulation are useful additions to the toolbox of infectious disease modellers. Further research is required to explicitly address the stochastic nature of the simulator as well as to account for correlations between outputs.
Conflict of interest statement
The authors have declared that no competing interests exist.
Figures

 is observed via
  and described by the simulator output
  . The simulator is substituted by the emulator for computational efficiency. The question marks indicate the various sources of uncertainty present in the system.

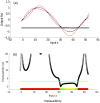
 (black dashed line). The value of
  is considered unknown apart from six points where the simulator is run and are represented by the black dots in the figure. The blue line is the emulator's posterior mean, and the red lines represent its posterior uncertainty (95% CI). The 3 horizontal lines represent the empirical data (mean value and 95% CI) that we use to history match the simulator. Panel (b) shows the implausibility for the emulator and the empirical data shown in panel (a). The implausibility is large when the emulator's posterior mean is far from the empirical data, relatively to the uncertainties present in the system (observation and code uncertainty in this case). The horizontal green line is an implausibility cut-off, which determines whether an input
  is implausible or not.
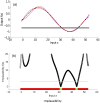
 (black dashed line). The value of
  is considered unknown apart from seven points where the simulator is run and are represented by the black dots in the figure. The blue line is the emulator's posterior mean, and the red lines represent its posterior uncertainty (95% CI). The 3 horizontal lines represent the empirical data (mean value and 95% CI) that we use to history match the simulator. Panel (b) shows the implausibility for the emulator and the empirical data shown in panel (a). The implausibility is large when the emulator's posterior mean is far from the empirical data, relatively to the uncertainties present in the system (observation and code uncertainty in this case). The horizontal green line is an implausibility cut-off, which determines whether an input
  is implausible or not.
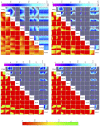
 probability of encountering a non-implausible point for different values of pairs of inputs.
 probability of encountering a non-implausible point for different values of pairs of inputs.
 less than the value indicated by the x-axis.


References
-
- Law A (2007) Simulation modeling and analysis. McGraw Hill.
-
- Grimm V, Railsback SF (2005) Individual-based Modeling and Ecology. Princeton University Press.
-
- White RG, Glynn JR, Orroth KK, Freeman E, Bakker R (2008) Male circumcision for HIV prevention in sub-saharan Africa: who, what and when? AIDS 22: 1841–1850. - PubMed
Publication types
MeSH terms
Grants and funding
LinkOut - more resources
Full Text Sources
Other Literature Sources
Medical

