. 2015 Jan;56(1):147-57.
doi: 10.1111/epi.12882. Epub 2015 Jan 9.

Hospital crossover increases utilization for people with epilepsy: a retrospective cohort study

Affiliations

Hospital crossover increases utilization for people with epilepsy: a retrospective cohort study

Zachary M Grinspan et al. Epilepsia. 2015 Jan.

Abstract

Objectives: "Hospital crossover" occurs when people visit multiple hospitals for care, which may cause gaps in electronic health records. Although crossover is common among people with epilepsy, the effect on subsequent use of health services is unknown. Understanding this effect will help prioritize health care delivery innovations targeted for this population.

Methods: We collected de-identified information from a health information exchange network describing 7,836 people with epilepsy who visited any of seven hospitals in New York, NY from 2009-2012. Data included demographics, comorbidities, and 2 years of visit information from ambulatory, inpatient, emergency department (ED), and radiology settings. We performed two complementary retrospective cohort analyses, in order to (1) illustrate the effect on a carefully selected subgroup, and (2) confirm the effect across the study population. First, we performed a matched cohort analysis on 410 pairs of individuals with and without hospital crossover in the baseline year. Second, we performed a propensity score odds weighted ordinal logistic regression analysis to estimate the effect across all 7,836 individuals. The outcomes were the use of six health services in the follow-up year.

Results: In the matched pair analysis, baseline hospital crossover increased the odds of more visits in the ED (odds ratio 1.42, 95% confidence interval [CI] 1.05-1.95) and radiology settings (1.7, 1.22-2.38). The regression analysis confirmed the ED and radiology findings, and also suggested that crossover led to more inpatient admissions (1.35, 1.11-1.63), head CTs (1.44, 1.04-2), and brain MRIs (2.32, 1.59-3.37).

Significance: Baseline hospital crossover is an independent marker for subsequent increased health service use in multiple settings among people with epilepsy. Health care delivery innovations targeted for people with epilepsy who engage in hospital crossover should prioritize (1) sharing radiology images and reports (to reduce unnecessary radiology use, particularly head CTs), and (2) improving coordination of care (to reduce unnecessary ED and inpatient use).

Keywords: Care coordination; Epilepsy; Health information exchange; Health information technology; Health services research.


Conflict of interest statement

CONFLICT OF INTEREST

Dr. Shapiro was a paid consultant for Healthix Inc., from 2011 to 2012. The remaining authors have no conflicts of interest. The funding sources had no role in any of the following: design and conduct of the study; collection, management, analysis, and interpretation of the data; and preparation, review, or approval of the manuscript; furthermore, funding sources had no role in the decision to submit the manuscript for publication. We confirm that we have read the Journal’s position on issues involved in ethical publication and affirm that this report is consistent with those guidelines.

Figures

Figure 1
Figure 1. Patient timelines in a de-identified data set in a longitudinal cohort study
The timelines for three example patients are represented in green, red, and blue. For each patient, the date of the initial diagnosis of 345.x or 780.39 was used as a start date to begin observation. Use of anonymized, date-shifted dates prevents knowledge of when in “Study Year 1” any patient was recruited. Thus we were able to follow each patient only for two full years, despite having three years of data. Note that each patient’s year does not typically correspond to a study year, and that a given patient’s year 1 is typically not the same as another patient’s year 1. For each patient, we measured baseline characteristics (hospital crossover, baseline utilization, demographics, and comorbidities) in that patient’s year 1 (baseline year), and subsequent utilization in that patient’s year 2 (follow-up year).
Figure 2
Figure 2. Distribution of baseline utilization among 410 matched pairs of people with epilepsy with and without hospital crossover
Each bar represents 410 people with epilepsy, in either the crossover or non-crossover group. The shading illustrates the relative proportion of people who used the given health service 0, 1, 2–4, or 5 or more times in the baseline year. Darker colors indicate more use. Pairs of bars compare those without hospital crossover (left) to those with hospital crossover (right), for six health services. Dashed lines connect similar levels of use; lines that slope up from left to right indicate more use among individuals with crossover. The goodness of the match is indicated numerically by the absolute value of Cohen’s d, and qualitatively as “exact” for |d| = 0 or “excellent” for 0 < |d| ≤ 0.07.
Figure 3
Figure 3. Distribution of subsequent utilization among 410 matched pairs of people with epilepsy with and without hospital crossover
Each bar represents 410 people with epilepsy, in either the crossover or non-crossover group. The shading illustrates the relative proportion of people who used the given health service 0, 1, 2–4, or 5 or more times in the follow-up year. Darker colors indicate more use. Pairs of bars compare those without hospital crossover (left) to those with hospital crossover (right), for six health services. Dashed lines connect similar levels of use; lines that slope up from left to right indicate more use among individuals with crossover. Statistical comparisons were performed via the Sign Test for matched pairs, and the p-values appear in the figure.
Figure 4
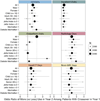
Figure 4. Adjusted odds ratio of more (vs. less) use in follow-up year among patients with baseline crossover for six utilization outcomes in nine subgroups
Adjusted odds ratios from subgroups of weighted ordinal logistic regression analyses. The solid vertical lines represent an odds ratio of 1 (i.e. no effect). The dotted line is the odds ratio calculated in the weighted ordinal logistic regression analysis of the entire cohort of 7836 people with epilepsy. The size of the point is proportional to the number of people in subgroup. Grey horizontal lines are 95% confidence intervals of the adjusted odds ratio. Visually, if the grey horizontal lines cross the dotted lines, it indicates that the adjusted odds ratio in the subgroup did not differ significantly than the adjusted odds ratio of the entire cohort (“All”). Missing points indicate the subgroup analysis did not converge.

References

    1. Finnell JT, Overhage JM, Grannis S. All health care is not local: an evaluation of the distribution of Emergency Department care delivered in Indiana. AMIA Annu Symp Proc. 2011;2011:409–416. - PMC - PubMed
    1. Grinspan ZM, Abramson EL, Banerjee S, et al. People with epilepsy who use multiple hospitals; prevalence and associated factors assessed via a health information exchange. Epilepsia. 2014 Mar 5; [Epub ahead of print] - PMC - PubMed
    1. Grinspan ZM, Abramson EL, Banerjee S, et al. Potential value of health information exchange for people with epilepsy: crossover patterns and missing clinical data. AMIA Annu Symp Proc. 2013;2013:527–536. - PMC - PubMed
    1. Stiell A, Forster AJ, Stiell IG, et al. Prevalence of information gaps in the emergency department and the effect on patient outcomes. CMAJ : Canadian Medical Association journal = journal de l’Association medicale canadienne. 2003 Nov 11;169:1023–1028. - PMC - PubMed
    1. Smith PC, Araya-Guerra R, Bublitz C, et al. Missing clinical information during primary care visits. Jama. 2005 Feb 2;293:565–571. - PubMed

Publication types

MeSH terms