. 2015 Mar;185(3):679-92.
doi: 10.1016/j.ajpath.2014.11.018. Epub 2015 Jan 5.

Identification of a human papillomavirus-associated oncogenic miRNA panel in human oropharyngeal squamous cell carcinoma validated by bioinformatics analysis of the Cancer Genome Atlas

Affiliations

Identification of a human papillomavirus-associated oncogenic miRNA panel in human oropharyngeal squamous cell carcinoma validated by bioinformatics analysis of the Cancer Genome Atlas

Daniel L Miller et al. Am J Pathol. 2015 Mar.

Abstract

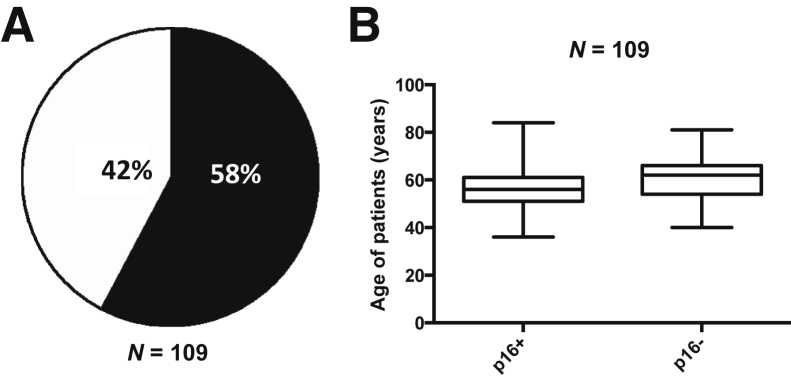
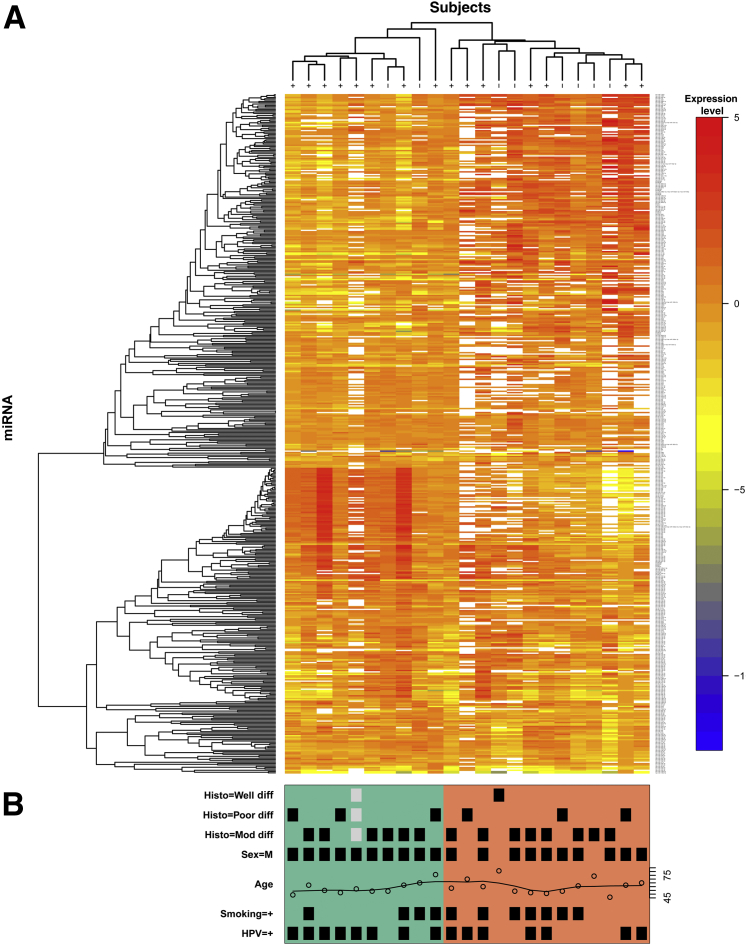
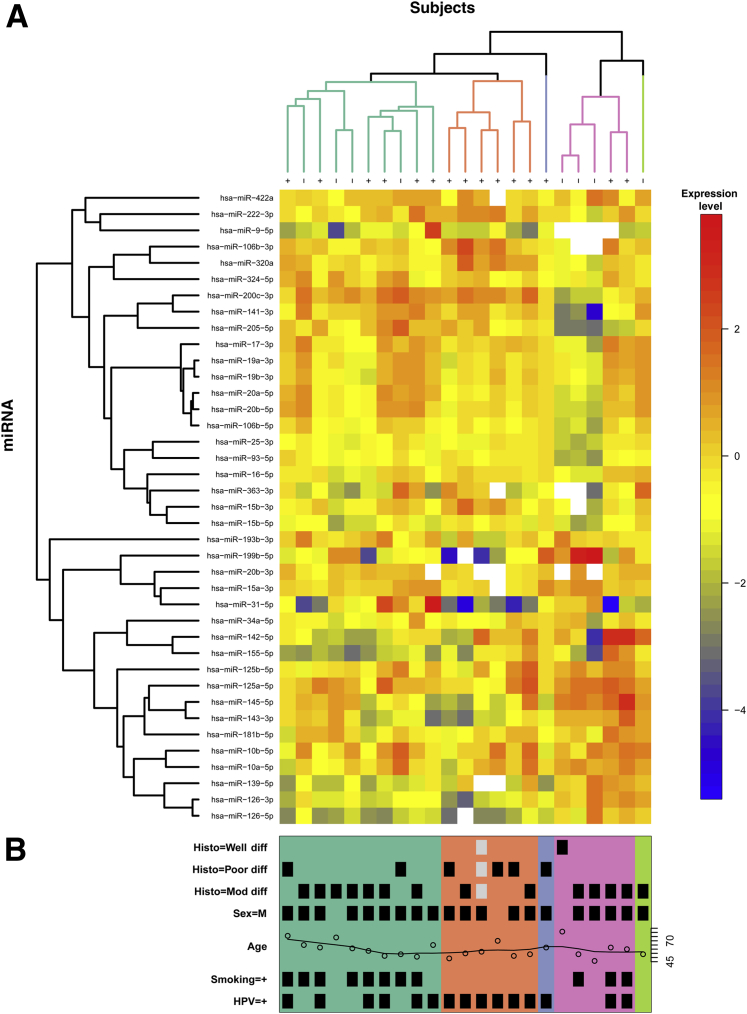
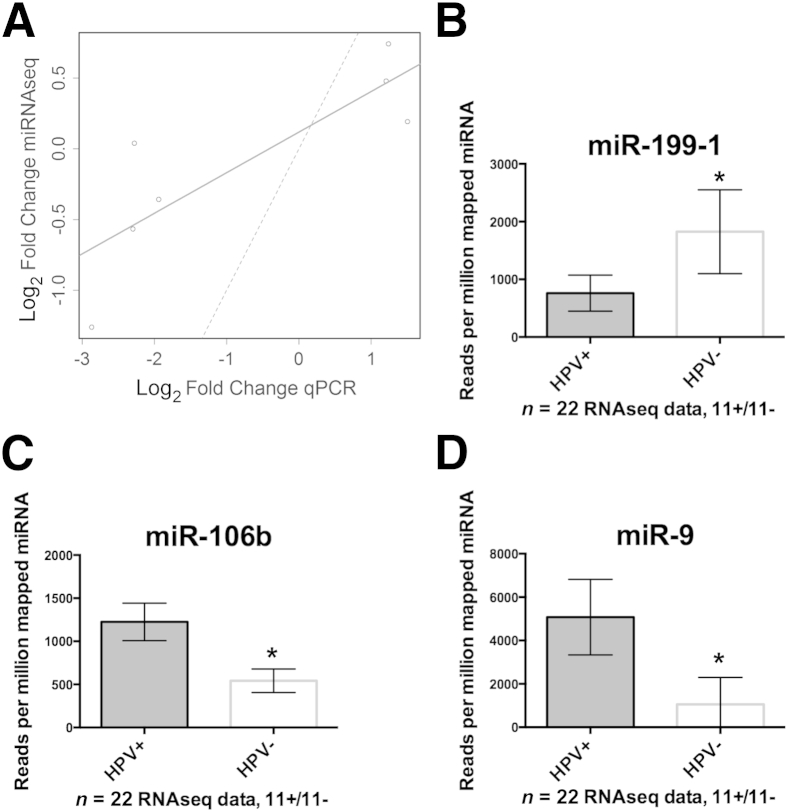
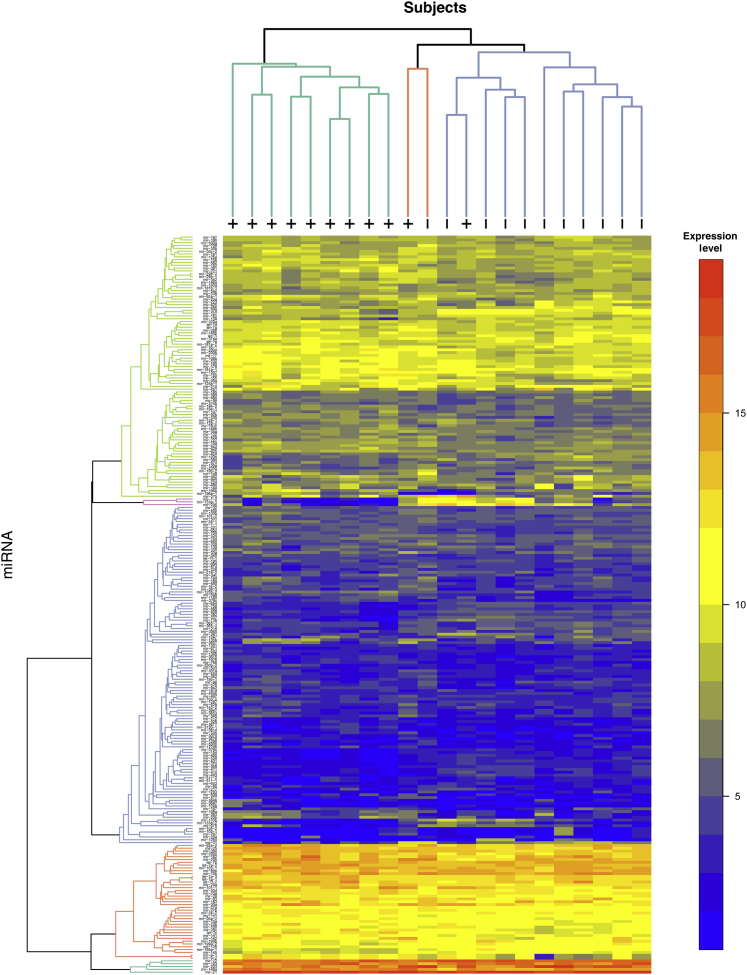
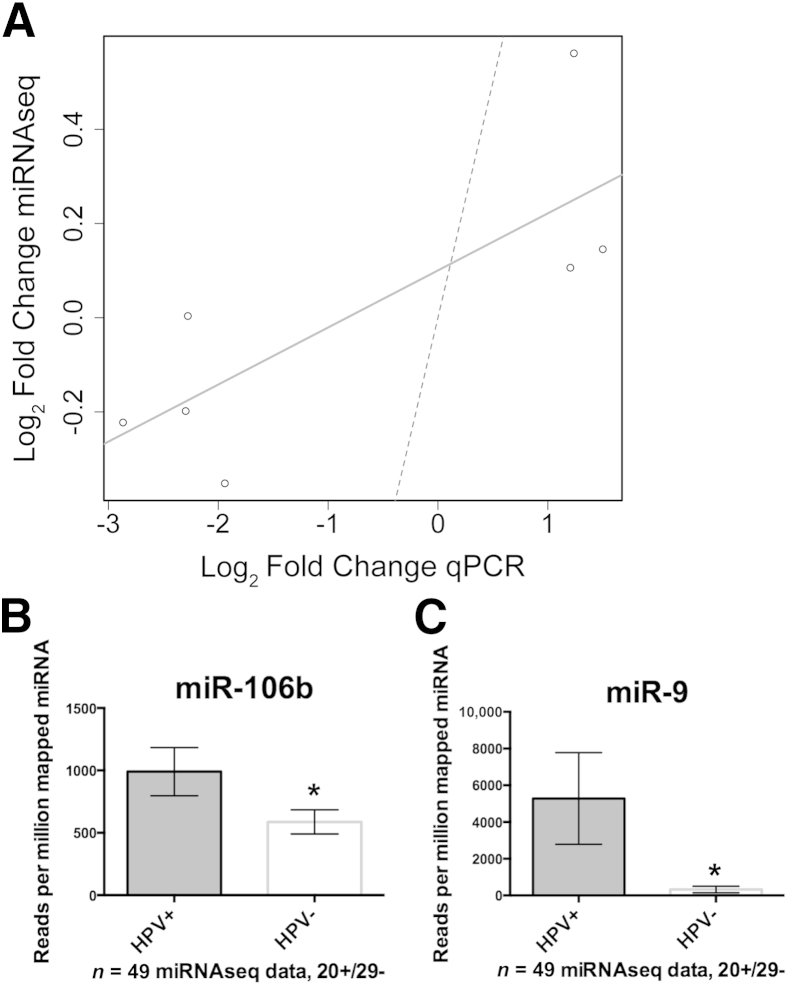
High-risk human papillomavirus (HPV) is a causative agent for an increasing subset of oropharyngeal squamous cell carcinomas (OPSCCs), and current evidence supports these tumors as having identifiable risk factors and improved response to therapy. However, the biochemical and molecular alterations underlying the pathobiology of HPV-associated OPSCC (designated HPV(+) OPSCC) remain unclear. Herein, we profile miRNA expression patterns in HPV(+) OPSCC to provide a more detailed understanding of pathologic molecular events and to identify biomarkers that may have applicability for early diagnosis, improved staging, and prognostic stratification. Differentially expressed miRNAs were identified in RNA isolated from an initial clinical cohort of HPV(+/-) OPSCC tumors by quantitative PCR-based miRNA profiling. This oncogenic miRNA panel was validated using miRNA sequencing and clinical data from The Cancer Genome Atlas and miRNA in situ hybridization. The HPV-associated oncogenic miRNA panel has potential utility in diagnosis and disease stratification and in mechanistic elucidation of molecular factors that contribute to OPSCC development, progression, and differential response to therapy.


Figures

Figure 1
Figure 1
Human papillomavirus (HPV) prevalence in formalin-fixed, paraffin-embedded (FFPE) cases. A: The clinical history for patients diagnosed between 2006 to 2011 was reviewed, archived FFPE tissue blocks were assessed for available tissue, and available hematoxylin and eosin slides were reviewed. After an Institutional Review Board–approved protocol, tissues were sectioned, stained for p16 protein expression, and scored as positive or negative as described. The results showed that 58% of cases were HPV+ as defined in Materials and Methods. B: The average ages in the p16+ and p16 cohorts under study were 56.49 and 61.00 years, respectively. In the boxplot, the median is denoted by the solid horizontal line within the rectangle. The top boundary is at 75th percentile and the bottom boundary is at the 25th percentile. The whiskers extending from the rectangle are set at 1.5× the interquartile range.
Figure 2
Figure 2
Profiling of miRNA expression on formalin-fixed, paraffin-embedded samples by quantitative RT-PCR. Tumors from 23 patients, including 15 p16+ and eight p16 samples, were profiled as described in Materials and Methods. A: An unsupervised hierarchical clustering heat map of normalized data (before nonspecific filtering or testing) representing 511 miRNAs is shown, with red indicating greater levels of relative expression, blue lesser levels, and white unreliable data (CT > 30 or CT = 0). The dendrogram at the top of the heat map illustrates which patient samples had the most similar miRNA profiles, whereas the dendrogram on the left (y axis) illustrates which miRNAs had similar profiles across patients. Items that were most similar were linked sooner to each other than items that were less similar. B: Clinical information is shown for each sample, with a black square marking the presence of the indicated variable (gray indicates missing data); green [8 of 10 human papillomavirus (HPV) positive] and salmon (6 of 13 HPV) shading indicate how the samples cluster into two groups. Diff, differentiated.
Figure 3
Figure 3
Unsupervised hierarchical clustering heat map of miRNA expression in formalin-fixed, paraffin-embedded samples. A: An unsupervised hierarchical clustering heat map of normalized data representing 39 selected miRNAs is shown, with red indicating greater levels of relative expression, blue lesser levels, and white unreliable data (CT > 30 or CT = 0). The dendogram at the top of the heat map illustrates which patient samples had the most similar miRNA profiles, whereas the dendrogram on the left (y axis) illustrates which miRNAs had similar profiles across patients. Items that were most similar were linked sooner to each other than items that were less similar. B: Clinical information is shown for each sample, with a black square marking the presence of the indicated variable (gray indicates missing data); the samples sort into five distinct clusters, with most samples falling into three groups: green [mostly smokers regardless of human papillomavirus (HPV) status], salmon and blue (all HPV+ nonsmokers), and pink and bright green (mixed). Diff, differentiated.
Figure 4
Figure 4
Analysis of The Cancer Genome Atlas (TCGA) cohort 1 miRNA sequencing (miRNAseq) data. A: Patients composing TCGA cohort 1 were identified as described. The graph shows comparison of the seven differentially expressed miRNAs identified by PCR profiling of microdissected formalin-fixed, paraffin-embedded (fold changes in log2 scale for symmetry) versus results obtained from analysis of TCGA cohort 1 miRNAseq data. Strong concordance between the data sets was obtained based on the Spearman rank correlation (rho = 0.85; P = 0.02) and the Pearson product moment correlation (r = 0.83; P = 0.02; 95% CI, 0.210.97). A best-fit line (solid) indicated this relative concordance, whereas a 45° reference line (dashed) indicated that there was not perfect absolute agreement between the data sets and the assay technique. B: Mean normalized miRNA read counts showing miR-199-1 as a validated human papillomavirus (HPV)–associated miRNA. C: Mean normalized miRNA read counts showed up-regulation of miR-106b in HPV+ tumors. D: Mean normalized read counts showed that miR-9 was significantly up-regulated in HPV+ tumors. All the error bars indicate 95% CIs. P < 0.05. qPCR, real-time quantitative PCR.
Figure 5
Figure 5
Heat map of normalized expression data from The Cancer Genome Atlas (TCGA) cohort 1. The color scale represents greater (red) or lesser (blue) levels of relative expression across TCGA head and neck squamous cell carcinoma samples (columns) and miRNAs (rows). Unsupervised hierarchical clustering of the samples and the miRNAs was performed using Euclidean distance and the average linkage methods, and the resulting dendrograms are shown in the margins, where + or − indicates human papillomavirus (HPV) status. Items that are most similar cluster lower in the dendrogram. There seem to be two distinct clusters of samples, one entirely HPV+ and the other mostly HPV, as well as four distinct clusters of miRNAs. As an example, reflecting the color scale, the bottom rows show miRNA expressed across all samples at levels of 15,000 to 320,000 reads per million miRNA mapped (Supplemental Table S4).
Figure 6
Figure 6
Analysis of The Cancer Genome Atlas (TCGA) cohort 2 miRNA sequencing (miRNAseq) data. A: Patients in TCGA cohort 2 were identified as described in Materials and Methods. The graph shows comparison of the seven differentially expressed miRNAs identified by PCR profiling of microdissected formalin-fixed, paraffin-embedded (fold changes in log2 scale) versus results obtained from analysis of TCGA cohort 2 miRNAseq data. A strong concordance between data sets was obtained based on the Spearman rank correlation (rho = 0.75; P = 0.06) and the Pearson product moment correlation (r = 0.78; P = 0.03; 95% CI, 0.070.96). A best-fit line (solid) indicates this relative concordance, whereas a 45° reference line (dashed) indicates that there is not perfect absolute agreement between the data sets and the assay technique. B: Mean normalized miRNA read counts showing miR-106b as a validated human papillomavirus (HPV)–associated miRNA. C: Mean normalized miRNA read counts showing miR-9 as a validated HPV-associated miRNA. All the error bars indicate 95% CIs. P < 0.05. qPCR, real-time quantitative PCR.
Figure 7
Figure 7
In situ hybridization (ISH) analysis of miR-9 expression in head and neck squamous cell carcinoma. A–D: Low-power images depicting ISH patterns for miR-9 in four oropharyngeal squamous cell carcinoma tissue cores. The ISH signal is represented by a deep purple color. The counterstain for miRNA-probed tissues sections was nuclear fast red; therefore, purple coloration represents ISH signal and pink/red is the counterstain. A and C: Human papillomavirus (HPV)–positive tumors showed a strong ISH signal. B and D: HPV tumors had a weak or absent ISH signal. E–H: High-power images depicting ISH patterns for miR-9 in four oropharyngeal squamous cell carcinoma tissue cores. Staining in HPV+ cores was punctate (E) or diffuse (G), whereas HPV tumors had weak or absent signal. I–L: Corresponding hematoxylin and eosin images. Original magnification: ×100 (A–D); ×400 (E–L).
Figure 8
Figure 8
Odds ratios (ORs) and mosaic plots of high-tumor miR-9 occurring in relation to p16 status. A–C: The odds that high-tumor miR-9 expression occurs in the setting of p16+ disease were more than three times greater (OR = 3.38; P < 0.001; 95% CI, 1.846.26) than the odds of low-tumor miR-9 expression in p16+; similarly, the odds of diffuse miR-9 in situ hybridization (ISH) were nearly four times greater in p16+ (OR = 3.87; P < 0.001; 95% CI, 2.107.20) than the odds of nondiffuse miR-9 ISH in p16+. D–F: The ORs increased when the outcome was validated human papillomavirus (HPV) mRNA ISH. The model prediction based on HPV mRNA ISH had sensitivity = 0.62 and specificity = 0.875.

References

    1. Miller D.L., Puricelli M.D., Stack M.S. Virology and molecular pathogenesis of HPV (human papillomavirus)-associated oropharyngeal squamous cell carcinoma. Biochem J. 2012;443:339–353. - PMC - PubMed
    1. Gillison M.L., D'Souza G., Westra W., Sugar E., Xiao W., Begum S., Viscidi R. Distinct risk factor profiles for human papillomavirus type 16-positive and human papillomavirus type 16-negative head and neck cancers. J Natl Cancer Inst. 2008;100:407–420. - PubMed
    1. Ang K.K., Harris J., Wheeler R., Weber R., Rosenthal D.I., Nguyen-Tân P.F., Westra W.H., Chung C.H., Jordan R.C., Lu C., Kim H., Axelrod R., Silverman C.C., Redmond K.P., Gillison M.L. Human papillomavirus and survival of patients with oropharyngeal cancer. N Engl J Med. 2010;363:24–35. - PMC - PubMed
    1. Marur S., D'Souza G., Westra W.H., Forastiere A.A. HPV-associated head and neck cancer: a virus-related cancer epidemic. Lancet Oncol. 2010;11:781–789. - PMC - PubMed
    1. Chaturvedi A.K., Engels E.A., Pfeiffer R.M., Hernandez B.Y., Xiao W., Kim E., Jiang B., Goodman M.T., Sibug-Saber M., Cozen W., Liu L., Lynch C.F., Wentzensen N., Jordan R.C., Altekruse S., Anderson W.F., Rosenberg P.S., Gillison M.L. Human papillomavirus and rising oropharyngeal cancer incidence in the United States. J Clin Oncol. 2011;29:4294–4301. - PMC - PubMed

Publication types

MeSH terms

LinkOut - more resources