. 2015 Mar;5(3):316-31.
doi: 10.1158/2159-8290.CD-14-0736. Epub 2015 Jan 8.

JAK-STAT pathway activation in malignant and nonmalignant cells contributes to MPN pathogenesis and therapeutic response

Affiliations

JAK-STAT pathway activation in malignant and nonmalignant cells contributes to MPN pathogenesis and therapeutic response

Maria Kleppe et al. Cancer Discov. 2015 Mar.

Abstract

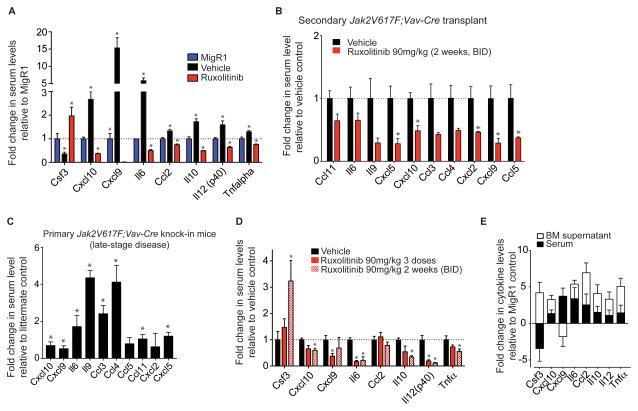
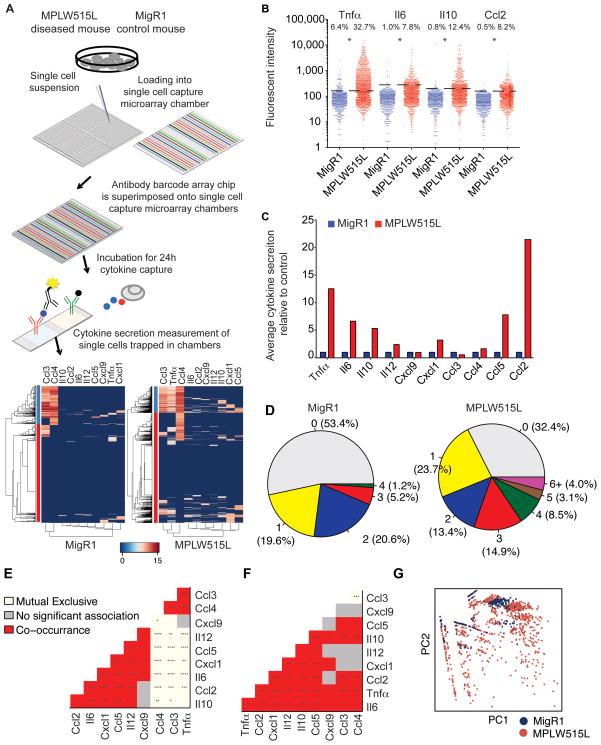
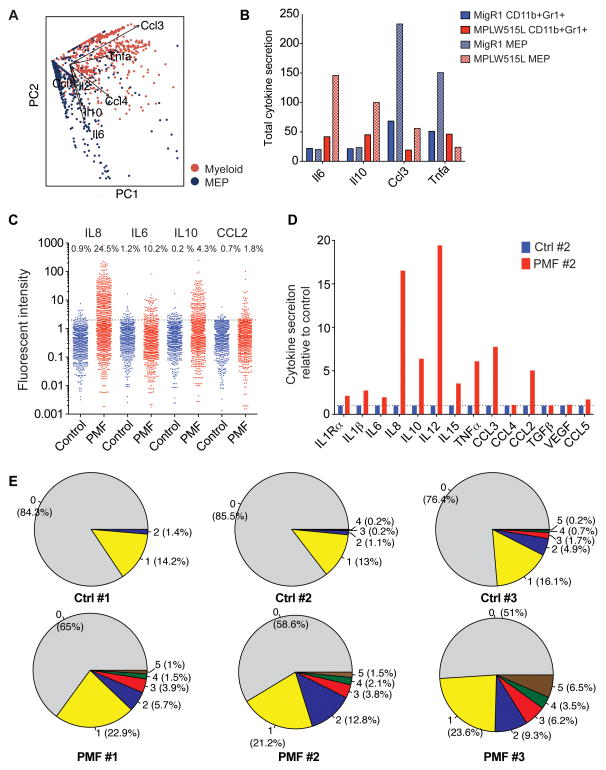
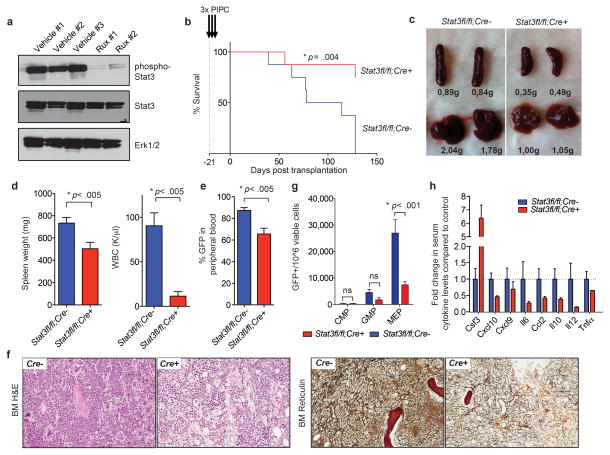
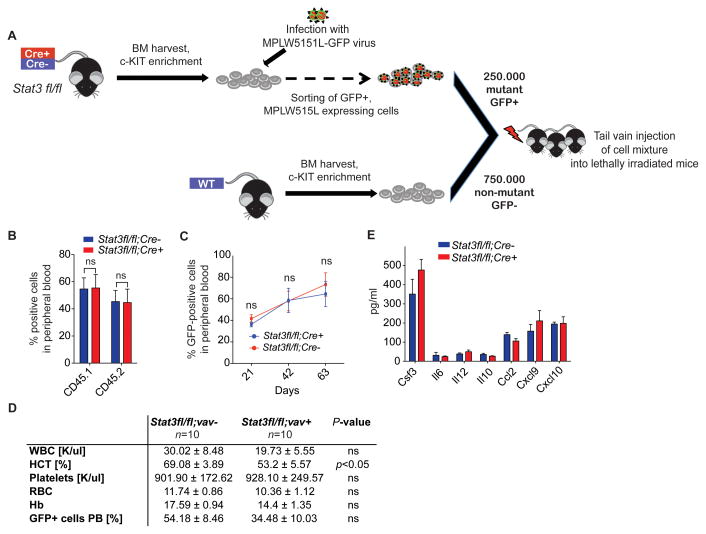
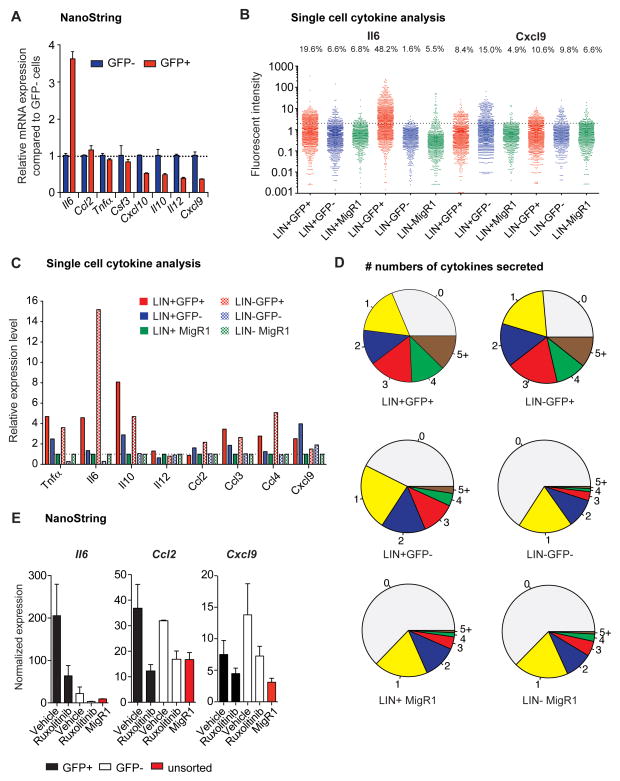
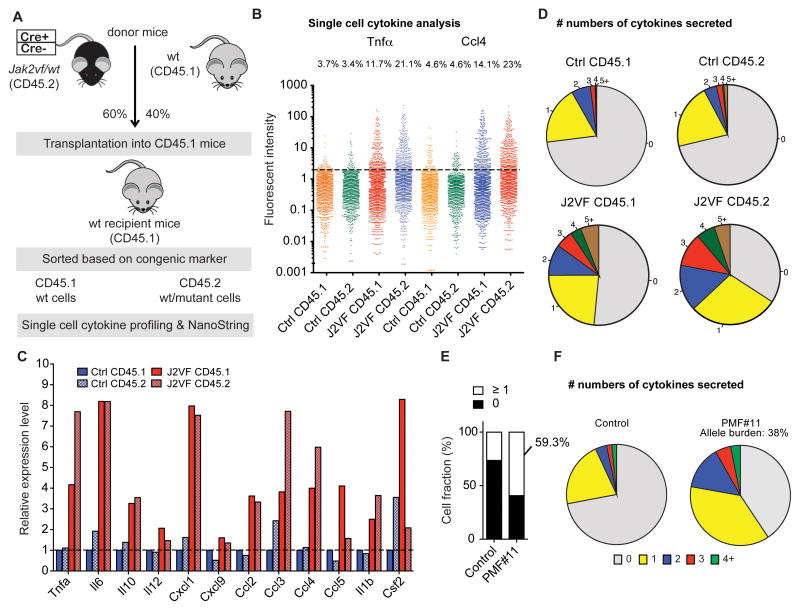
The identification of JAK2/MPL mutations in patients with myeloproliferative neoplasms (MPN) has led to the clinical development of JAK kinase inhibitors, including ruxolitinib. Ruxolitinib reduces splenomegaly and systemic symptoms in myelofibrosis and improves overall survival; however, the mechanism by which JAK inhibitors achieve efficacy has not been delineated. Patients with MPN present with increased levels of circulating proinflammatory cytokines, which are mitigated by JAK inhibitor therapy. We sought to elucidate mechanisms by which JAK inhibitors attenuate cytokine-mediated pathophysiology. Single-cell profiling demonstrated that hematopoietic cells from myelofibrosis models and patient samples aberrantly secrete inflammatory cytokines. Pan-hematopoietic Stat3 deletion reduced disease severity and attenuated cytokine secretion, with similar efficacy as observed with ruxolitinib therapy. In contrast, Stat3 deletion restricted to MPN cells did not reduce disease severity or cytokine production. Consistent with these observations, we found that malignant and nonmalignant cells aberrantly secrete cytokines and JAK inhibition reduces cytokine production from both populations.

Significance: Our results demonstrate that JAK-STAT3-mediated cytokine production from malignant and nonmalignant cells contributes to MPN pathogenesis and that JAK inhibition in both populations is required for therapeutic efficacy. These findings provide novel insight into the mechanisms by which JAK kinase inhibition achieves therapeutic efficacy in MPNs.


Conflict of interest statement

Conflict of interest disclosure statement: TR, MM, MR, and VR are employees of Novartis Institutes for BioMedical Research. PK is currently an employee of Amgen and JSF was an employee of Incyte Corporation. RLL received grant support from Novartis for this study.

Figures

Figure 1
Figure 1. Pro-inflammatory cytokines are elevated in MF mice and normalized with JAK inhibition
A, Changes in cytokine levels in vehicle- and ruxolitinib-treated MPLW515L mice compared with MigR1 mice. n=6. *P<.05. B, Ruxolitinib (90mg/kg, twice a day) reduces cytokines in mice transplanted with Jak2V617F;Vav-Cre-positive cells. n=4. *P <.05. C, Log2 fold changes in serum cytokine levels in primary Jak2V617F knock-in mice (late stage disease) compared to age-matched littermate controls are shown. Mean ± SEM, n=9 in each group. D, Short-term treatment (3 doses, 90mg/kg, BID) with ruxolitinib efficiently reduces serum cytokine levels in MPLW515L diseased mice. Log2 fold changes are displayed. n=4. *P<.05. E, Log2-fold changes in serum and bone marrow supernatant in MPLW515L mice compared to MigR1 mice. Mean ± s.e.m.
Figure 2
Figure 2. Bone marrow cells are potent cytokine producers
A, Schematic display of single cell cytokine secretion analysis workflow and hierarchical clustering of single cell data from MPLW515L and MigR1 whole bone marrow. Log2-transformed values were used for cluster analysis. B, Normalized fluorescent intensity for different cytokines. Numbers on top show cytokine secretion frequency. Dotted lines indicate cytokine secretion threshold. *P< .05. C, Total secretion levels (cytokine secretion fraction x average secretion intensity of cytokine secreting cells) of MPLW515L mice bone marrow (MPLW515L) relative to healthy control mice (MigR1) are shown. D, Pie charts depicting proportion of MigR1 and MPLW515L bone marrow cells secreting different numbers of cytokines (0–10). E, Mutual exclusivity analysis for MF cells. FDR: + < 0.05, ++ < 0.01 +++ < 0.001 and ++++ < 0.0001. Red/White without pluses is FDR < 0.1. F, Comparison between co-secretion patterns observed in MF and control cells. Colors visualize FDR. G, PCA of MPLW515L and MigR1 cytokine secretion. MPLW515L: n=2254 cells, MigR1 cells: n=608 cells.
Figure 3
Figure 3. Pathologic secretion of multiple cytokines by MF cells
A, PCA analysis of single cell cytokine secretion data from MPLW515L-expressing MEP and myeloid cells identified two principal components, largely defined by production of Il6 and Il10 (PC1, MEP) Ccl3, and Tnfa (PC2, myeloid). B, Total secretion levels (cytokine secretion fraction x average secretion intensity of cytokine secreting cells) of sorted GFP-positive cells from MPLW515L mice bone marrow (MPLW515L) compared to control healthy mice (MigR1) are shown. C, Normalized fluorescent intensity for different cytokines. Numbers on top show cytokine secretion frequency. Dotted lines indicate cytokine secretion threshold. D, Total secretion levels of human PMF granulocytes (PMF #2) relative to control cells (Ctrl #2) are shown. PMF #2: n=1318 analyzed cells, control granulocytes: n=976 analyzed cells. E, Pie charts depicting percentage of human PMF granulocytes (PMF) and control cells secreting different numbers of cytokines. Numbers in brackets represent the percentage of cells secreting a given number of cytokines.
Figure 4
Figure 4. Deletion of Stat3 reduces cytokine production and ameliorates MF in vivo
A, Western blot analysis of splenocytes from vehicle/ruxolitinib-treated MPLW515L diseased mice. B–D Deletion of Stat3 prolongs survival (B, n=8) and reduces organomegaly (C) and leukocytosis (D) in the MPLW515L BMT model compared to control mice. Mean ± s.e.m. of two independent experiments. E, Peripheral blood flow cytometric analysis. F, Reduced bone marrow cellularity and reticulin fibrosis in the bone marrow of MPLW515L-expressing Stat3fl/fl;Vav-Cre+ and MPLW515L-expressing Stat3fl/fl;Vav-Cre− mice. Representative pictures of three independent experiments. 20x magnification. G, Number of GFP-positive MEP cells is decreased in the bone marrow of mice transplanted with MPLW515L-expressing Stat3-deleted bone marrow compared to MPLW515L-diseased controls. Mean ± s.e.m. of two independent experiments. Vav-Cre+: n=16, Vav-Cre−: n=10. H, Stat3 deletion reduces serum cytokines in MPLW515L-transplanted recipient mice. Vav-Cre+: n=10, Vav-Cre−: n=7. Mean ± s.e.m.
Figure 5
Figure 5. Mutant-restricted deletion of Stat3 does not affect disease severity in vivo
A, Schematic illustration of bone marrow transplantation experiments using Stat3-deficient mice or littermate control mice as donors. Bone marrow cells were harvested from Stat3 knock-out or wild-type control littermates, infected with MSCV-hMPLW515L-IRES-GFP and sorted for GFP. 250,000 GFP-positive cells were injected with 750,000 wild-type support marrow into lethally irradiated, wild-type (CD45.1) recipient mice. B, Depiction of peripheral blood chimerism of CD45.1-positive recipient mice transplanted with sorted CD45.2-positive MPLW515L-expressing; Stat3fl/fl;Vav-Cre+/− cells and CD45.1 support (d14 post transplantation). C, Deletion of Stat3 in the mutant compartment does not reduce the proportion of GFP-positive cells in the peripheral blood, n=10/group of which 4 were sacrificed at day 48 for analysis. D, Elevated cytokine levels with mutant-specific Stat3 deletion. E, Differential blood counts of diseased mice which were transplanted with Stat3fl/fl;Cre-Vav+ or Stat3fl/fl;Cre-Vav− MPLW515L transduced cells with 500,000 wild-type support marrow. n=10/group.
Figure 6
Figure 6. Pro-inflammatory cytokines are derived from malignant and non-malignant hematopoietic cells
A, NanoString mRNA cytokine expression levels in GFP-positive (GFP+) and GFP-negative (GFP−) cells. Normalized expression values calculated as relative change compared to GFP-negative cells. Results of one of two replicate experiments are displayed. B, Single cell cytokine analysis of sorted populations showing fluorescent intensity. MigR1-expressing bone marrow was used as control. Percentages of cytokine secreting cells are shown above. Dashed line indicates normalized cytokine secretion threshold. C, Cytokine expression of sorted GFP-positive/GFP-negative lineage-positive (LIN+) and lineage-negative (LIN−) cells of MPLW515L-diseased mice relative to MigR1 control bone marrow. D, Pie charts depicting percentage of sorted GFP-negative/positive lineage-positive/negative MF cells and MigR1 control cells secreting different numbers of cytokines. Numbers in brackets represent the percentage of cells secreting a given number of cytokines. E, NanoString expression data (mean ± s.e.m.) for lineage-positive GFP-positive and GFP-negative cells from vehicle/ruxolitinib-treated MPLW515L-diseased mice. Data from MigR1 transplanted mice are shown as control. n=3/group.
Figure 7
Figure 7. Aberrant cytokine production in CD45.2 mutant and CD45.1 non-mutant cells from JAK2V617F-diseased mice
A, Schematic illustration of bone marrow transplantation experiments using Jak2V617;Vav-Cre knock-in mice (CD45.2) as donors. B, Single cell analysis of sorted mutant (CD45.2) and non-mutant (CD45.1) populations from Jak2V617F-diseased mice (J2VF) and transplanted healthy controls (Ctrl). Percentages of cytokine secreting cells are shown above. C, Cytokine expression levels of sorted CD45.1-positive and –negative MF and Vav-Cre-negative control cells relative to CD45.1 control cells. D, Pie charts displaying the percentage of sorted mutant (CD45.2) and non-mutant (CD45.1) secreting different numbers of cytokines (0,1,2,3,4,5+). E, Cytokine secretion data showing that 59.3% of human PMF cells (patient PMF#11, allele burden: 38%) secrete at least one cytokine. F, Pie charts depicting the percentage of human PMF cells and control cells secreting different numbers of cytokines (0,1,2,3,4+).

Comment in

References

    1. Tefferi A, Vardiman JW. Myelodysplastic syndromes. N Engl J Med. 2009;361:1872–85. - PubMed
    1. Tam CS, Nussenzveig RM, Popat U, Bueso-Ramos CE, Thomas DA, Cortes JA, et al. The natural history and treatment outcome of blast phase BCR-ABL- myeloproliferative neoplasms. Blood. 2008;112:1628–37. - PMC - PubMed
    1. Delhommeau F, Jeziorowska D, Marzac C, Casadevall N. Molecular aspects of myeloproliferative neoplasms. Int J Hematol. 2010;91:165–73. - PubMed
    1. Baxter EJ, Scott LM, Campbell PJ, East C, Fourouclas N, Swanton S, et al. Acquired mutation of the tyrosine kinase JAK2 in human myeloproliferative disorders. Lancet. 2005;365:1054–61. - PubMed
    1. Kralovics R, Passamonti F, Buser AS, Teo SS, Tiedt R, Passweg JR, et al. A gain-of-function mutation of JAK2 in myeloproliferative disorders. The New England journal of medicine. 2005;352:1779–90. - PubMed

Publication types

MeSH terms