. 2015 Jan 8;4(2):109-18.
doi: 10.1242/bio.20137351.

Chemotactic response with a constant delay-time mechanism in Ciona spermatozoa revealed by a high time resolution analysis of flagellar motility

Affiliations

Chemotactic response with a constant delay-time mechanism in Ciona spermatozoa revealed by a high time resolution analysis of flagellar motility

Daisuke Miyashiro et al. Biol Open. .

Abstract

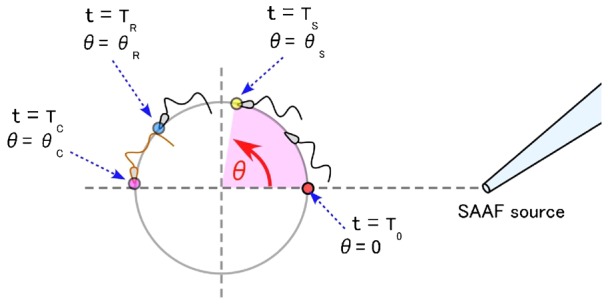
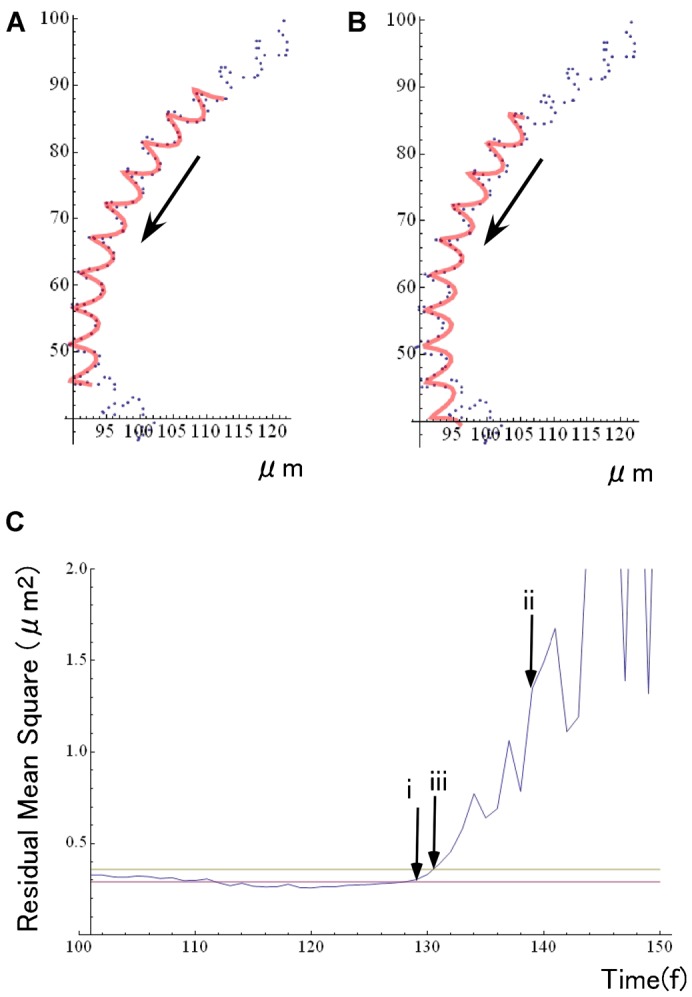
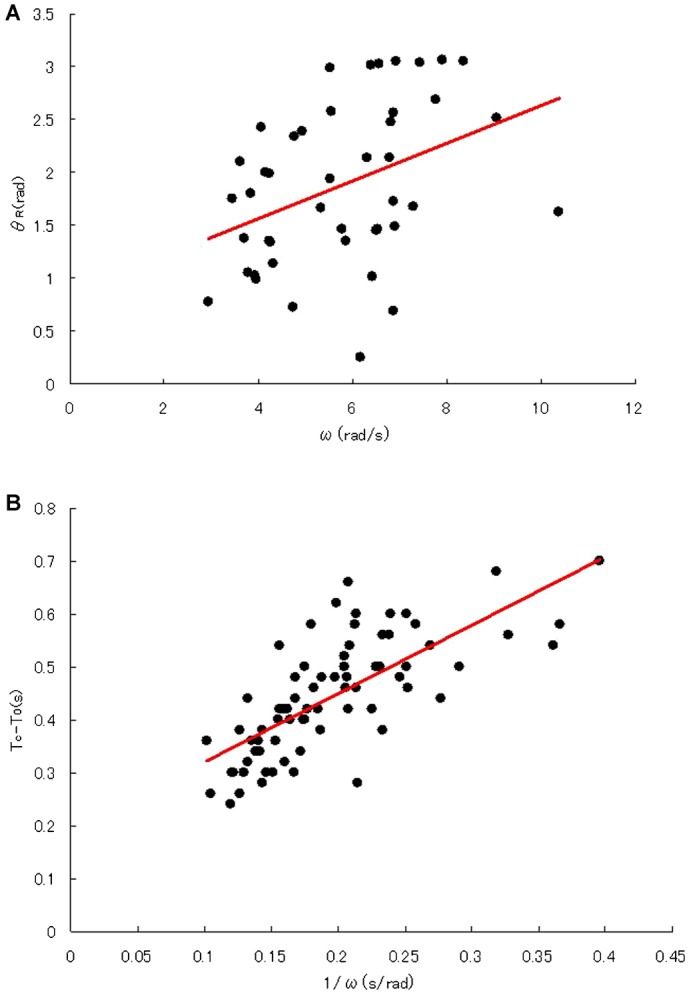
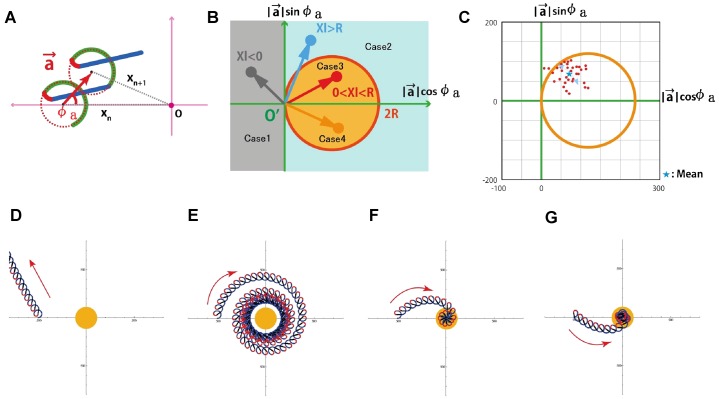
During their chemotactic swimming toward eggs, sperm cells detect their species-specific chemoattractant and sense concentration gradients by unknown mechanisms. After sensing the attractant, sperm cells commonly demonstrate a series of responses involving different swimming patterns by changing flagellar beats, gradually approaching a swimming path toward the eggs, which is the source of chemoattractants. Shiba et al. observed a rapid increase in intracellular Ca(2+) concentrations in Ciona spermatozoa after sensing chemoattractants; however, the biochemical processes occurring inside the sperm cells are unclear. In the present study, we focused on the timing and sensing mechanism of chemical signal detection in Ciona. One of the most crucial problems to be solved is defining the initial epoch of chemotactic responses. We adopted a high rate of video recording (600 Hz) for detailed analysis of sperm motion and a novel method for detecting subtle signs of beat forms and moving paths of sperm heads. From these analyses, we estimated a virtual sensing point of the attractant before initiation of motility responses and found that the time delay from sensing to motility responses was almost constant. To evaluate the efficiency of this constant delay model, we performed computer simulation of chemotactic behaviors of Ciona spermatozoa.

Keywords: Ciona intestinalis; Constant delay model; Flagellar motility; Sperm chemotaxis.


Conflict of interest statement

Competing interests: No competing interests declared.

Figures

Fig. 1.
Fig. 1.. Diagram illustrating the definition of angle (θ) and time (T).
T0 and θ = 0: when the head of swimming spermatozoa passes the line connecting center of the swimming orbit and the SAAF source (right side). Ts and θS: time and the angle when the spermatozoa sense the concentration change of SAAF, and a series of reaction of chemotactic signal transduction is initiated. TR and θR: when the first mechanical response of flagellar beat appears. TC and θC: when Ca2+ response is observed. The Ca2+ responses were not observed in the present study, but we assumed that the rise of Ca2+ concentration occurs at the same timing as reported previously.
Fig. 2.
Fig. 2.. Diagram illustrating our working hypothesis.
Definition of θ and T are as shown in Fig. 1.
Fig. 3.
Fig. 3.. Determination of TR from the analysis of the head trajectory.
(A,B) Observed center positions (center of brightness) of the heads of swimming spermatozoa (blue dots) and an empirical fitted curve (red lines) using the equation (3). (C) Plots of the summation of residual mean squares, i.e., squares of distance between the estimated and observed head position. At the time of arrow-i, which corresponds to the data shown in (A), we could fit the data of head position to an empirical equation with residuals less than a threshold of deviation (yellow line, Material & Methods). At the time of arrow-ii, which corresponds to the data shown in (B), it is clearly shown the residuals have already increased over the threshold. We determined the point arrow-iii in (C), the exact point for the residuals to cross over the threshold, the point where the sperm head position began sudden deviations from the predicted trajectory curves, which we assume to be TR, corresponding to the time when the first response after chemotactic stimuli started. Red line: mean residuals (summation of mean squares) obtained during the 120 frames prior to the video frame used for the analysis.
Fig. 4.
Fig. 4.. Detection of TR from the waveform analysis.
(A) Time course of calculated D(τ12), the waveform distance at τ2 from a fixed point at τ1. Red and yellow lines indicate the threshold D values reflecting waveform deviations without attractant stimuli, i.e., normal fluctuations of waveforms, obtained by the analysis with time resolution of 1/600 s and 1/1200 s, respectively. Green line indicates the value of threshold D that we used to detect the change of beating pattern. (B) Pseudo-color image indicating the value of D(τ12) in a plane τ1 versus τ1–τ2. From the data shown in (B), we extracted the value of minimum D and are plot against τ1 as in (C).
Fig. 5.
Fig. 5.. Analysis of θR and θS based on our working hypothesis of chemotactic responses.
(A) Diagram showing the correlation between θR and ω, the angular velocity of sperm swimming. According to the equation (1) in the text, delay time (TR–TS = 0.18 s), and the sensing point (θs = 0.85) are obtained from the line slope and y-intercept, respectively (n = 44, correlation coefficient = 0.388). (B) Diagram showing the correlation between TC–T0 and the inverse of swimming velocity (1/ω). According to the equation (2) in the text, the sensing point (θs = 1.3 rad) and the delay time (TC–TS = 0.19 s) are obtained from the line slope and y-intercept, respectively (n = 72, correlation coefficient = 0.727).
Fig. 6.
Fig. 6.. Kinetics model of signal transduction to explain the constant delay in chemotactic response.
(A) A minimum set of kinetics model, where a receptor activated by the chemoattractant (SAAF) accelerates downstream chemical reaction (k+2) that catalyzes the production of a second messenger (Product). (B) Simulated time course of product formation when the sinusoidal modulation of SAAF concentration was given. For the tentative calculations, k+1/k−1, k+2/k+3, substrate concentration, and receptor concentration of 0.25, 10, 1, and 16 were used, respectively. Although this model is composed of a tentative minimum set of kinetics parameters, we can mimic well the chemotactic responses with a constant delay phase of π/2 (1.6 rad). (C) Diagram showing the correlation between the concentrations of SAAF and the product. The time delay can be kept almost constant in a relatively wide range of SAAF concentrations.
Fig. 7.
Fig. 7.. Calculation of chemotactic efficiency.
(A) Definition of chemotactic vector (a, red arrows) as a connecting line from the n-th center of the circular orbit of sperm swimming (Xn) during resting state to the n+1-center of the next orbit (Xn+1) appearing after a series of chemotactic responses, i.e., resting → turning → straight-swimming → recovery to resting states. The center origin of coordinates features the egg (attractant source). Φn is the angle between a and [0, Xn]. (B) Diagram showing the vectors |a|·cosΦ versus |a|·sinΦ to categorize the chemotactic efficiencies. (C) The same diagram described with a real µm scale. (D–G) Simulated swimming paths of spermatozoa in Cases 1–4, respectively. The central yellow circle is an egg with a 120-µm diameter. If the tip end of vector a is placed on a circle described as 2R = |a|/cosΦa (orange circle), the spermatozoa always keep swimming with a constant distance from the egg. Vectors place outside and inside the circle correspond to diverging and converging swimming orbits, respectively. Here we show four examples of the chemotactic vector (Cases 1–4) that represent typical patterns of sperm swimming as shown in D–G, respectively. As shown in C, actual Ciona spermatozoa showed the vectors included in the category Case 3 with some fluctuations.

Similar articles

Cited by

References

    1. Alvarez L., Dai L., Friedrich B. M., Kashikar N. D., Gregor I., Pascal R., Kaupp U. B. (2012). The rate of change in Ca2+ concentration controls sperm chemotaxis. J. Cell Biol. 196, 653–663. 10.1083/jcb.201106096 - DOI - PMC - PubMed
    1. Alvarez L., Friedrich B. M., Gompper G., Kaupp U. B. (2014). The computational sperm cell. Trends Cell Biol. 24, 198–207. 10.1016/j.tcb.2013.10.004 - DOI - PubMed
    1. Böhmer M., Van Q., Weyand I., Hagen V., Beyermann M., Matsumoto M., Hoshi M., Hildebrand E., Kaupp U. B. (2005). Ca2+ spikes in the flagellum control chemotactic behavior of sperm. EMBO J. 24, 2741–2752. 10.1038/sj.emboj.7600744 - DOI - PMC - PubMed
    1. Cardullo R. A., Herrick S. B., Peterson M. J., Dangott L. J. (1994). Speract receptors are localized on sea urchin sperm flagella using a fluorescent peptide analog. Dev. Biol. 162, 600–607. 10.1006/dbio.1994.1113 - DOI - PubMed
    1. Cook S. P., Brokaw C. J., Muller C. H., Babcock D. F. (1994). Sperm chemotaxis: egg peptides control cytosolic calcium to regulate flagellar responses. Dev. Biol. 165, 10–19. 10.1006/dbio.1994.1229 - DOI - PubMed