Linkage disequilibrium network analysis (LDna) gives a global view of chromosomal inversions, local adaptation and geographic structure
- PMID: 25573196
- PMCID: PMC4681347
- DOI: 10.1111/1755-0998.12369
Linkage disequilibrium network analysis (LDna) gives a global view of chromosomal inversions, local adaptation and geographic structure
Abstract
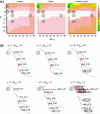
Recent advances in sequencing allow population-genomic data to be generated for virtually any species. However, approaches to analyse such data lag behind the ability to generate it, particularly in nonmodel species. Linkage disequilibrium (LD, the nonrandom association of alleles from different loci) is a highly sensitive indicator of many evolutionary phenomena including chromosomal inversions, local adaptation and geographical structure. Here, we present linkage disequilibrium network analysis (LDna), which accesses information on LD shared between multiple loci genomewide. In LD networks, vertices represent loci, and connections between vertices represent the LD between them. We analysed such networks in two test cases: a new restriction-site-associated DNA sequence (RAD-seq) data set for Anopheles baimaii, a Southeast Asian malaria vector; and a well-characterized single nucleotide polymorphism (SNP) data set from 21 three-spined stickleback individuals. In each case, we readily identified five distinct LD network clusters (single-outlier clusters, SOCs), each comprising many loci connected by high LD. In A. baimaii, further population-genetic analyses supported the inference that each SOC corresponds to a large inversion, consistent with previous cytological studies. For sticklebacks, we inferred that each SOC was associated with a distinct evolutionary phenomenon: two chromosomal inversions, local adaptation, population-demographic history and geographic structure. LDna is thus a useful exploratory tool, able to give a global overview of LD associated with diverse evolutionary phenomena and identify loci potentially involved. LDna does not require a linkage map or reference genome, so it is applicable to any population-genomic data set, making it especially valuable for nonmodel species.
Keywords: Anopheles dirus; Anopheles gambiae; chromosomal rearrangement; graph theory; landscape genomics; r package.
© 2015 The Authors. Molecular Ecology Resources Published by John Wiley & Sons Ltd.
Figures


Similar articles
-
Improving the population genetics toolbox for the study of the African malaria vector Anopheles nili: microsatellite mapping to chromosomes.Parasit Vectors. 2011 Oct 19;4:202. doi: 10.1186/1756-3305-4-202. Parasit Vectors. 2011. PMID: 22011455 Free PMC article.
-
Low linkage disequilibrium in wild Anopheles gambiae s.l. populations.BMC Genet. 2010 Sep 15;11:81. doi: 10.1186/1471-2156-11-81. BMC Genet. 2010. PMID: 20843306 Free PMC article.
-
Diversity, differentiation, and linkage disequilibrium: prospects for association mapping in the malaria vector Anopheles arabiensis.G3 (Bethesda). 2014 Jan 10;4(1):121-31. doi: 10.1534/g3.113.008326. G3 (Bethesda). 2014. PMID: 24281424 Free PMC article.
-
Genomics of natural populations: Evolutionary forces that establish and maintain gene arrangements in Drosophila pseudoobscura.Mol Ecol. 2017 Dec;26(23):6539-6562. doi: 10.1111/mec.14381. Epub 2017 Nov 15. Mol Ecol. 2017. PMID: 29055159
-
The population genetics of structural variation.Nat Genet. 2007 Jul;39(7 Suppl):S30-6. doi: 10.1038/ng2042. Nat Genet. 2007. PMID: 17597779 Free PMC article. Review.
Cited by
-
Complex patterns of genetic population structure in the mouthbrooding marine catfish, Bagre marinus, in the Gulf of Mexico and U.S. Atlantic.Ecol Evol. 2024 Jun 9;14(6):e11514. doi: 10.1002/ece3.11514. eCollection 2024 Jun. Ecol Evol. 2024. PMID: 38859886 Free PMC article.
-
Adaptive evolution in a conifer hybrid zone is driven by a mosaic of recently introgressed and background genetic variants.Commun Biol. 2021 Feb 5;4(1):160. doi: 10.1038/s42003-020-01632-7. Commun Biol. 2021. PMID: 33547394 Free PMC article.
-
Temperature-associated selection linked to putative chromosomal inversions in king scallop (Pecten maximus).Proc Biol Sci. 2022 Oct 12;289(1984):20221573. doi: 10.1098/rspb.2022.1573. Epub 2022 Oct 5. Proc Biol Sci. 2022. PMID: 36196545 Free PMC article.
-
Differing associations between sex determination and sex-linked inversions in two ecotypes of Littorina saxatilis.Evol Lett. 2022 Aug 12;6(5):358-374. doi: 10.1002/evl3.295. eCollection 2022 Oct. Evol Lett. 2022. PMID: 36254259 Free PMC article.
-
Linkage Disequilibrium Estimation in Low Coverage High-Throughput Sequencing Data.Genetics. 2018 Jun;209(2):389-400. doi: 10.1534/genetics.118.300831. Epub 2018 Mar 27. Genetics. 2018. PMID: 29588288 Free PMC article.
References
-
- Andrew RL, Bernatchez L, Bonin A, et al. A road map for molecular ecology. Molecular Ecology. 2013;22:2605–2626. - PubMed
-
- Ardlie KG, Kruglyak L, Seielstad M. Patterns of linkage disequilibrium in the human genome. Nature Reviews Genetics. 2002;3:299–309. - PubMed
-
- Baimai V, Poopittayasataporn A, Kijchalao U. Cytological differences and chromosomal rearrangements in four members of the Anopheles dirus complex (Diptera: Culicidae) Genome. 1988a;30:372–379. - PubMed
-
- Baimai V, Thu MM, Paing M. Distribution and chromosomal polymorphism of the malaria vector Anopheles dirus species D. The Southeast Asian Journal of Tropical Medicine and Public Health. 1988b;19:661–665. - PubMed
Publication types
MeSH terms
Grants and funding
LinkOut - more resources
Full Text Sources
Other Literature Sources
Research Materials

