. 2015 Apr;29(4):1577-90.
doi: 10.1096/fj.14-265066. Epub 2015 Jan 8.

Direct or indirect stimulation of adenosine A2A receptors enhances bone regeneration as well as bone morphogenetic protein-2

Affiliations

Direct or indirect stimulation of adenosine A2A receptors enhances bone regeneration as well as bone morphogenetic protein-2

Aránzazu Mediero et al. FASEB J. 2015 Apr.

Abstract

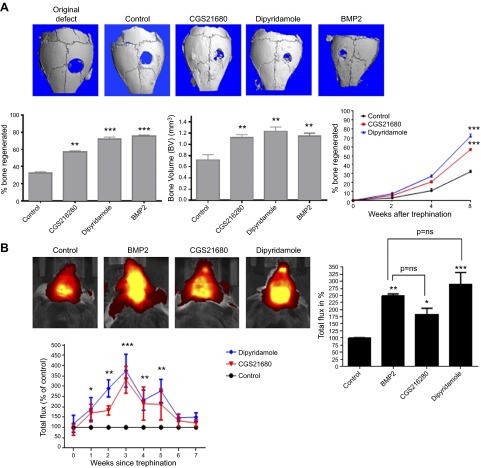
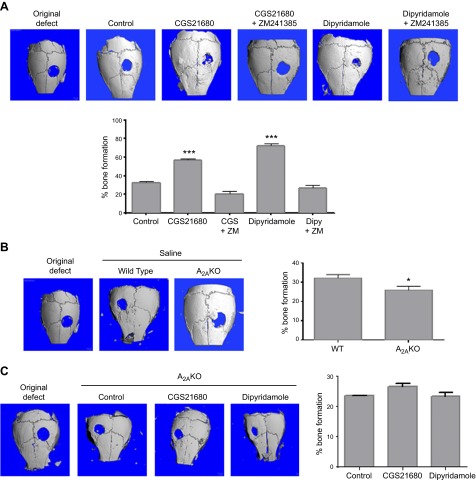
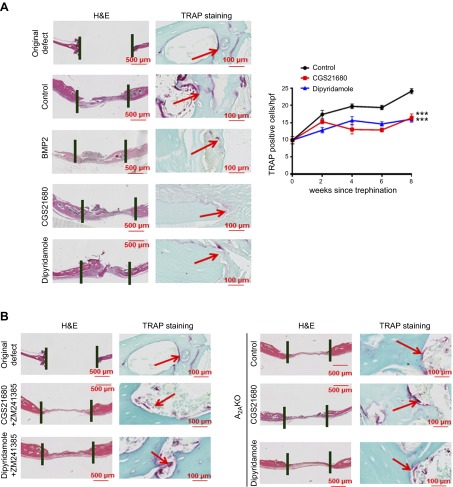
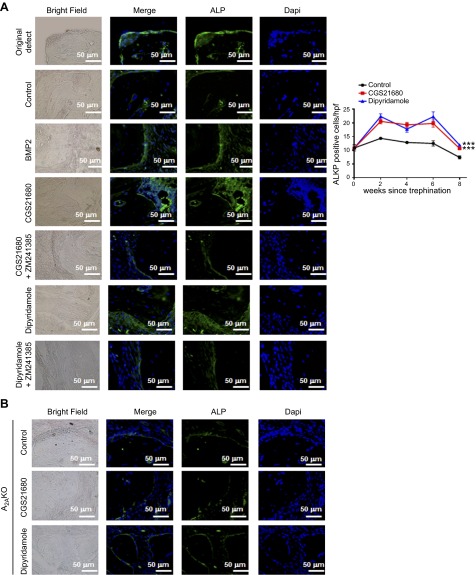
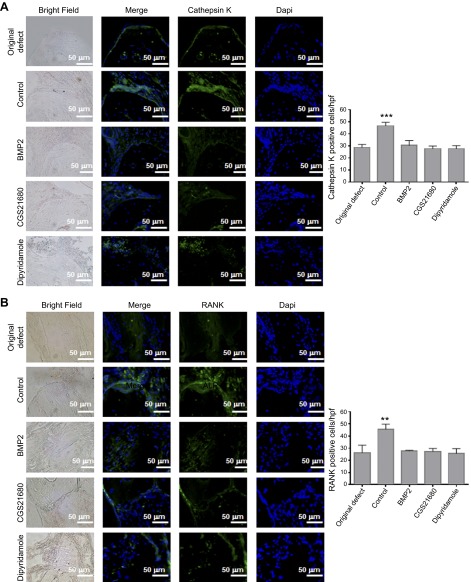
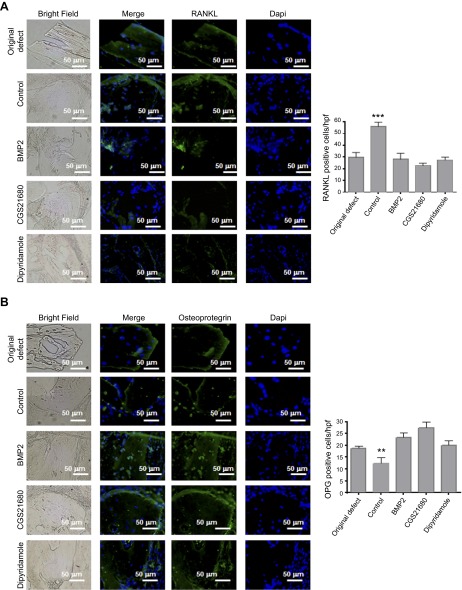
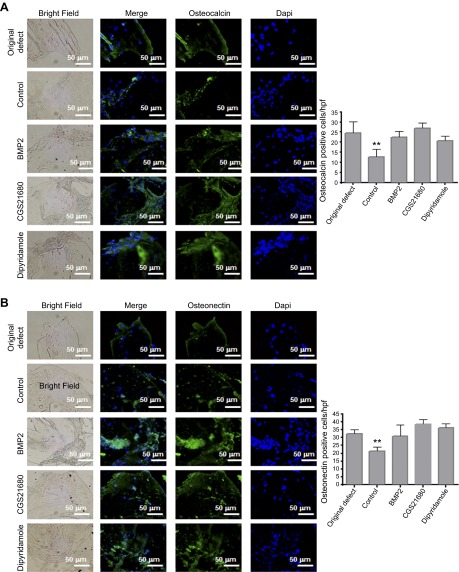
Promoting bone regeneration and repair of bone defects is a need that has not been well met to date. We have previously found that adenosine, acting via A2A receptors (A2AR) promotes wound healing and inhibits inflammatory osteolysis and hypothesized that A2AR might be a novel target to promote bone regeneration. Therefore, we determined whether direct A2AR stimulation or increasing endogenous adenosine concentrations via purine transport blockade with dipyridamole regulates bone formation. We determined whether coverage of a 3 mm trephine defect in a mouse skull with a collagen scaffold soaked in saline, bone morphogenetic protein-2 (BMP-2; 200 ng), 1 μM CGS21680 (A2AR agonist, EC50 = 160 nM), or 1 μM dipyridamole (EC50 = 32 nM) promoted bone regeneration. Microcomputed tomography examination demonstrated that CGS21680 and dipyridamole markedly enhanced bone regeneration as well as BMP-2 8 wk after surgery (60 ± 2%, 79 ± 2%, and 75 ± 1% bone regeneration, respectively, vs. 32 ± 2% in control, P < 0.001). Blockade by a selective A2AR antagonist (ZM241385, 1 μM) or deletion of A2AR abrogated the effect of CGS21680 and dipyridamole on bone regeneration. Both CGS21680 and dipyridamole treatment increased alkaline phosphatase-positive osteoblasts and diminished tartrate resistance acid phosphatase-positive osteoclasts in the defects. In vivo imaging with a fluorescent dye for new bone formation revealed a strong fluorescent signal in treated animals that was equivalent to BMP-2. In conclusion, stimulation of A2AR by specific agonists or by increasing endogenous adenosine levels stimulates new bone formation as well as BMP-2 and represents a novel approach to stimulating bone regeneration.

Keywords: CGS21680; bone formation; dipyridamole; osteoblast; osteoclast.


Figures

Figure 1.
Figure 1.
CGS21680 (A2AR agonist) and dipyridamole (adenosine uptake inhibitor) promote bone growth in a similar fashion as BMP-2. C57Bl/6 mice were anesthetized; a 3 mm trephine defect was formed and covered with a collagen scaffold soaked in saline, CGS21680 1 μM, dipyridamole 1 μM, or BMP-2 200 ng. A) The figures show representative microCT images of calvaria. Graphs indicate morphometric quantitation of microCT analysis. Percentage of bone formation was calculated by subtracting the remaining defect area to the total defect area. BV units in mm3. B) One week after surgery, XenoLight RediJect Bone Probe 680 conjugate was injected intravenously, and the fluorescence image was captured weekly. Total flux in photons per second were normalized and expressed as a percentage of control to avoid intrinsic changes among animals. Red indicates low signal intensity and low rates of new bone formation, whereas yellow indicates high signal intensity and high rates of new bone formation. Data were expressed as mean ± sem (n = 5 per group). **P < 0.01 and ***P < 0.001 compared with control (ANOVA).
Figure 2.
Figure 2.
The presence of A2A receptors is required to increase bone formation. C57Bl/6 or A2AKO mice were anesthetized; a 3 mm trephine defect was formed and covered with a collagen scaffold soaked in CGS21680 1 μM or dipyridamole 1 μM alone or in combination with ZM241385 1 μM. A) The figures show representative microCT images of calvaria treated with CGS21680 or dipyridamole alone or in combination with ZM241385. Graphs indicate morphometric quantitation of microCT analysis. B) The figures show representative microCT images of saline-treated WT calvaria compared with saline-treated A2AKO calvaria. Graphs indicate morphometric quantitation of microCT analysis. C) The figures show representative microCT images of A2AKO mice calvaria treated with CGS21680 or dipyridamole. Graphs indicate morphometric quantitation of microCT analysis. Data were expressed as mean ± sem (n = 5 per group). * P < 0.05 and ***P < 0.001 compared with control (ANOVA).
Figure 3.
Figure 3.
CGS21680 and dipyridamole decrease TRAP-positive cells 8 weeks after trephination in an A2AR-dependent manner. A) Five micrometer sections of WT mice calvaria were stained with hematoxylin and eosin to determine new bone formation. Figures indicate representative images for TRAP staining for osteoclast in calvaria treated with saline, BMP-2, CGS21680, and dipyridamole. Graph show quantification of the number of osteoclast per hpf (5 fields per slide). Results shown are means ± sem (n = 5 mice per group). B) Five micrometer sections of WT mice calvaria were stained with hematoxylin and eosin to determine new bone formation. Figures indicate representative images for TRAP staining for osteoclast in calvaria treated with CGS21680 and dipyridamole in combination with ZM241385. C) Five micrometer sections from A2AKO mice calvaria were stained with hematoxylin and eosin to determine new bone formation. Figures indicate representative images for alkaline phosphatase and TRAP staining for osteoblasts and osteoclasts in calvaria treated with saline, CGS21680, and dipyridamole. Images were taken at the same magnification: ×100 and ×40. Scale bar indicates 500 and 100 μm. ***P < 0.001 (ANOVA).
Figure 4.
Figure 4.
CGS21680 and dipyridamole increase bone formation 8 weeks after trephination. Calvaria were processed and immunohistologic staining carried out. A) Representative sections of WT mice calvaria treated with saline, BMP-2, CGS21680, dipyridamole, CGS21680 + ZM241385, and dipyridamole + ZM241385 (from n = 5 mice per group) stained for alkaline phosphatase (green). Graph show quantification of the number of osteoclast per hpf (5 fields per slide). Results shown are means ± sem (n = 5 mice per group). B) Representative sections of A2AKO mice calvaria (from n = 5 mice per group) stained for alkaline phosphatase (green). Nucleus is shown in blue (DAPI). All images were taken at the same magnification (×400). Scale bar indicates 50 μm.
Figure 5.
Figure 5.
Immunohistochemistry for markers of osteoclasts and bone remodeling. WT calvaria treated with saline, BMP-2, CGS21680, and dipyridamole were processed and immunohistologic staining was carried out. A) Representative images for cathepsin K (green). B) Representative sections of calvaria (from n = 5 mice per group) stained for RANK (green). Nucleus is shown in blue (DAPI). Graphs show quantification of the number of cells per hpf (5 fields per slide). Data are means ± sem (n = 5 mice per group). **P < 0.01 and ***P < 0.001 (ANOVA). All images were taken at the same magnification (×400). Scale bar indicates 50 μm.
Figure 6.
Figure 6.
Immunohistochemistry for markers of bone remodeling. WT calvaria treated with saline, BMP-2, CGS21680, and dipyridamole were processed, and immunohistologic staining was carried out. A) Representative images for RANKL (green). B) Representative sections of calvaria (from n = 5 mice per group) stained for OPG (green). Nucleus is shown in blue (DAPI). Graphs show quantification of the number of cells per hpf (5 fields per slide). Data are means ± sem (n = 5 mice per group). **P < 0.01 and ***P < 0.001 (ANOVA). All images were taken at the same magnification (×400). Scale bar indicates 50 μm.
Figure 7.
Figure 7.
Immunohistochemistry for markers of bone remodeling. WT calvaria treated with saline, BMP-2, CGS21680, and dipyridamole were processed, and immunohistologic staining was carried out. A) Representative images for osteocalcin (green). B) Representative sections of calvaria (from n = 5 mice per group) stained for osteonectin (green). Nucleus is shown in blue (DAPI). Graphs show quantification of the number of cells per hpf (5 fields per slide). Data are means ± sem (n = 5 mice per group). **P < 0.01 and ***P < 0.001 (ANOVA). All images were taken at the same magnification (×400). Scale bar indicates 50 μm.

Similar articles

Cited by

References

    1. Schindeler A., McDonald M. M., Bokko P., Little D. G. (2008) Bone remodeling during fracture repair: The cellular picture. Semin. Cell Dev. Biol. 19, 459–466 - PubMed
    1. Tsiridis E., Upadhyay N., Giannoudis P. (2007) Molecular aspects of fracture healing: which are the important molecules? Injury 38(Suppl 1), S11–S25 - PubMed
    1. Pape H. C., Marcucio R., Humphrey C., Colnot C., Knobe M., Harvey E. J. (2010) Trauma-induced inflammation and fracture healing. J. Orthop. Trauma 24, 522–525 - PubMed
    1. Riley E. H., Lane J. M., Urist M. R., Lyons K. M., Lieberman J. R. (1996) Bone morphogenetic protein-2: biology and applications. Clin. Orthop. Relat. Res. (324):39–46 - PubMed
    1. Boden S. D., Kang J., Sandhu H., Heller J. G. (2002) Use of recombinant human bone morphogenetic protein-2 to achieve posterolateral lumbar spine fusion in humans: a prospective, randomized clinical pilot trial: 2002 Volvo Award in clinical studies. Spine 27, 2662–2673 - PubMed

Publication types

MeSH terms

Substances