

Using isoelectric point to determine the pH for initial protein crystallization trials
- PMID: 25573921
- PMCID: PMC4410668
- DOI: 10.1093/bioinformatics/btv011
Using isoelectric point to determine the pH for initial protein crystallization trials
Abstract
Motivation: The identification of suitable conditions for crystallization is a rate-limiting step in protein structure determination. The pH of an experiment is an important parameter and has the potential to be used in data-mining studies to help reduce the number of crystallization trials required. However, the pH is usually recorded as that of the buffer solution, which can be highly inaccurate.
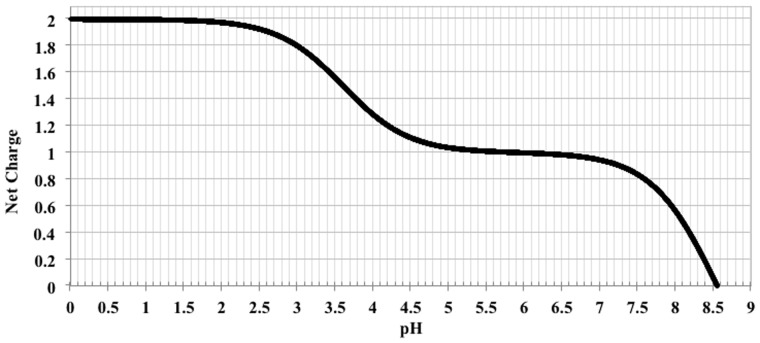
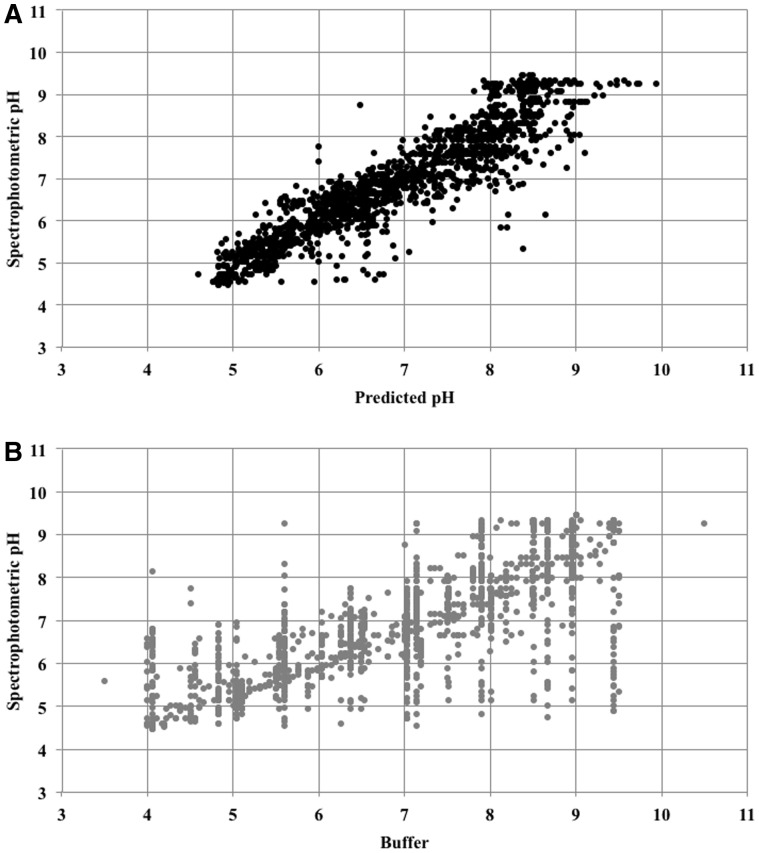
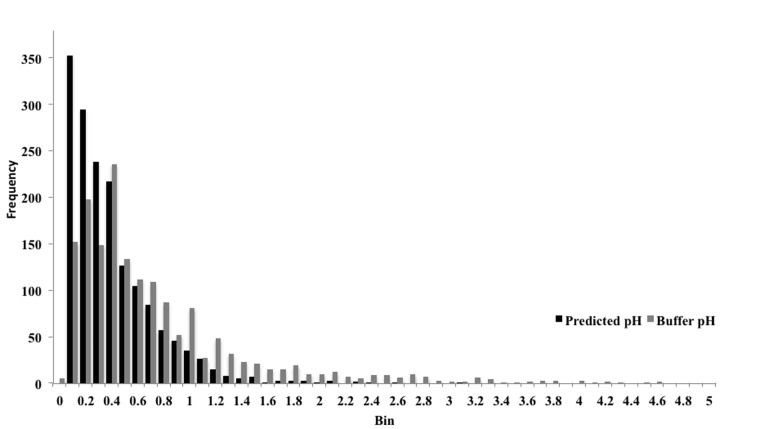
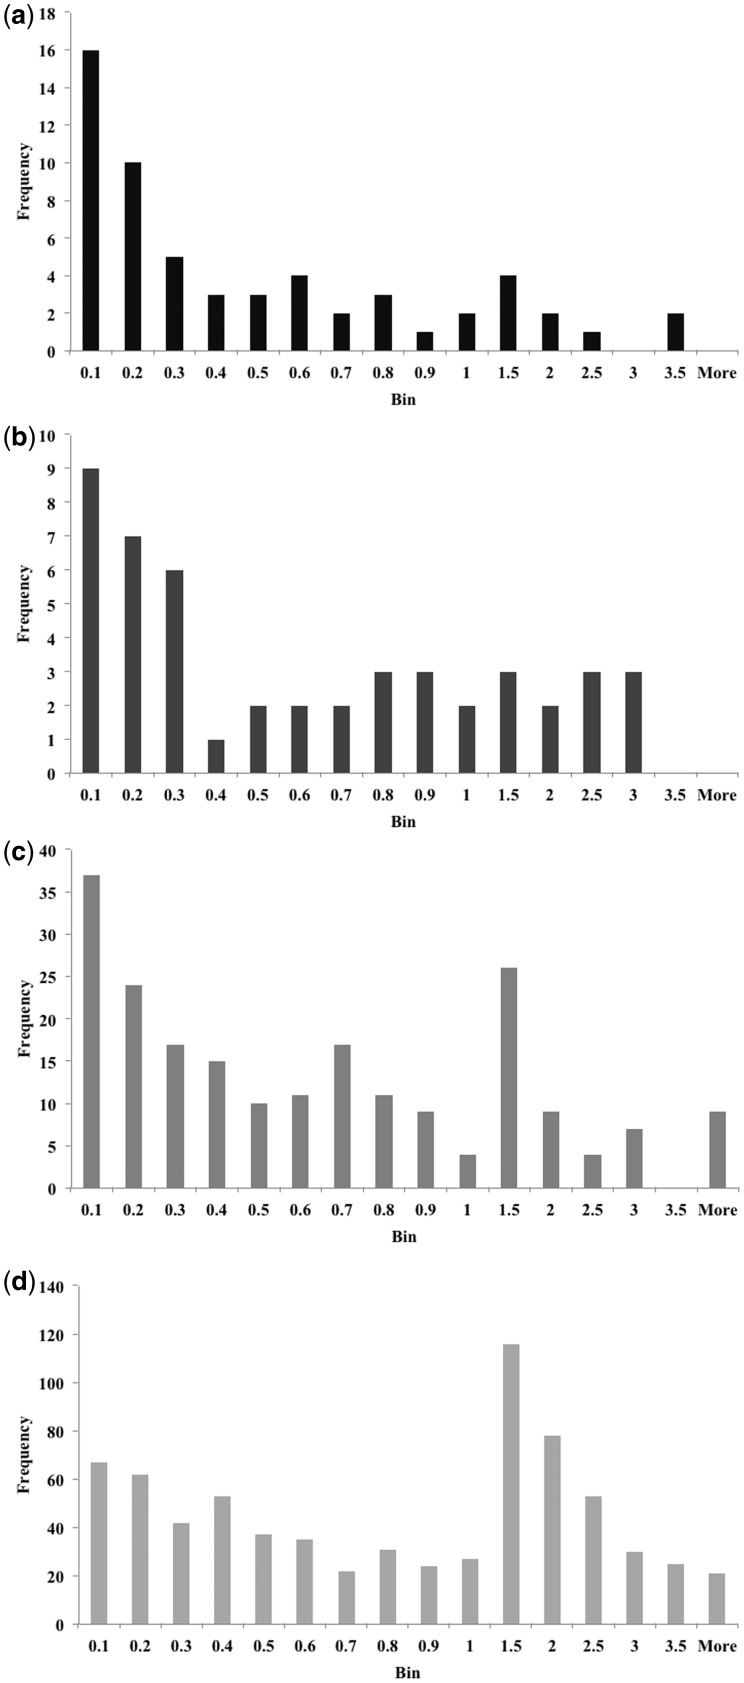
Results: Here, we show that a better estimate of the true pH can be predicted by considering not only the buffer pH but also any other chemicals in the crystallization solution. We use these more accurate pH values to investigate the disputed relationship between the pI of a protein and the pH at which it crystallizes.
Availability and implementation: Data used to generate models are available as Supplementary Material.
Contact: julie.wilson@york.ac.uk
Supplementary information: Supplementary data are available at Bioinformatics online.
© The Author 2015. Published by Oxford University Press.
Figures
References
-
- Beale R., Jackson T. (1990) Neural Computing: An Introduction. IOP Publishing Ltd, Bristol, UK.
-
- Bukrinsky J.T., Poulsen J.C.N. (2001) pH, conductivity and long-term stability in the Crystal Screen solutions. J. Appl. Crystallogr., 34, 533–534.
-
- Caffrey M. (2003) Membrane protein crystallization. J. Struct. Biol., 142, 108–132. - PubMed
-
- Charles M., et al. . (2006) MPCD: a new interactive on-line crystallization data bank for screening strategies. Acta Crystallogr. D Biol. Crystallogr., 62, 1311–1318. - PubMed
Publication types
MeSH terms
Substances
Grants and funding
LinkOut - more resources
Full Text Sources
Other Literature Sources
Research Materials
Miscellaneous
