. 2015 May 1;24(9):2442-57.
doi: 10.1093/hmg/ddv006. Epub 2015 Jan 8.

Htt CAG repeat expansion confers pleiotropic gains of mutant huntingtin function in chromatin regulation

Affiliations

Htt CAG repeat expansion confers pleiotropic gains of mutant huntingtin function in chromatin regulation

Marta Biagioli et al. Hum Mol Genet. .

Abstract

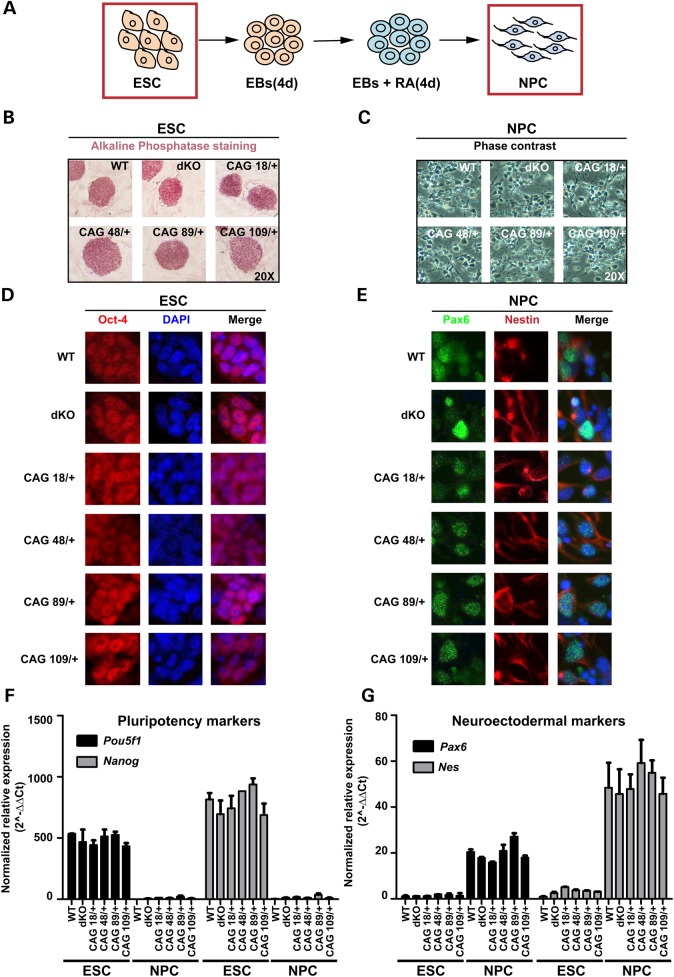
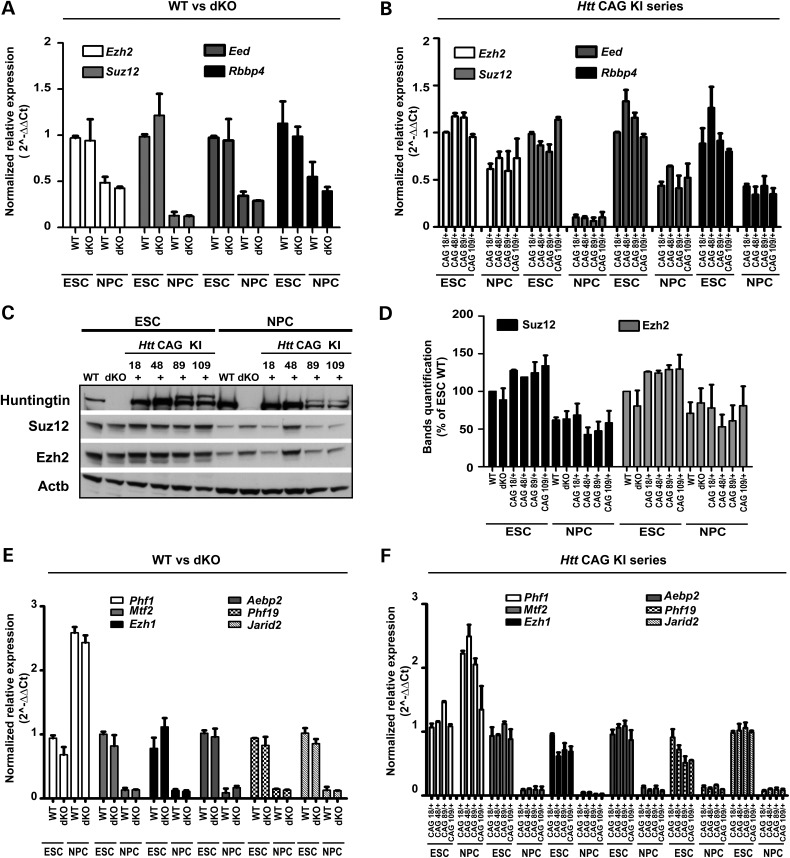
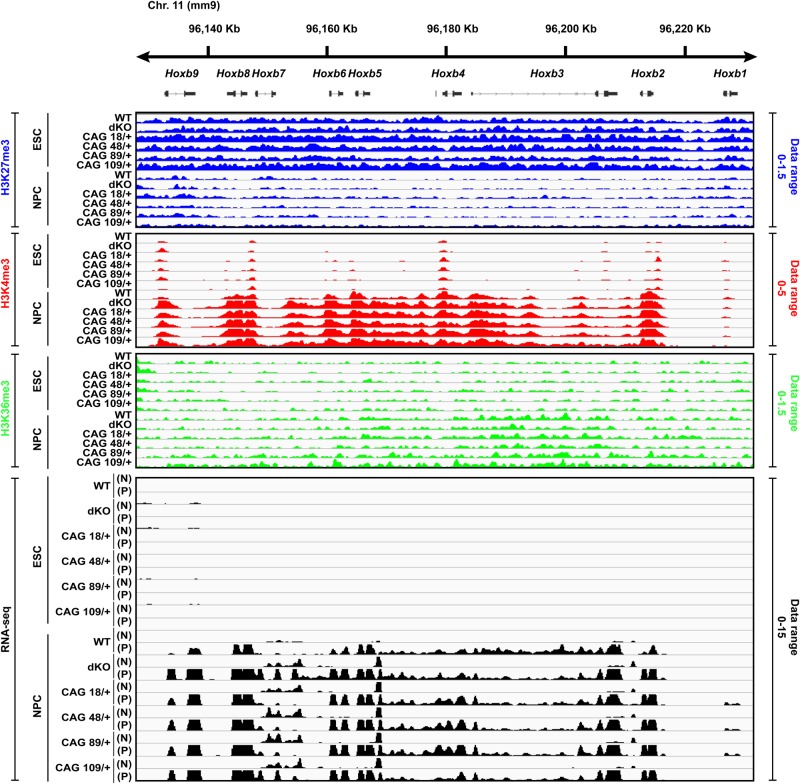
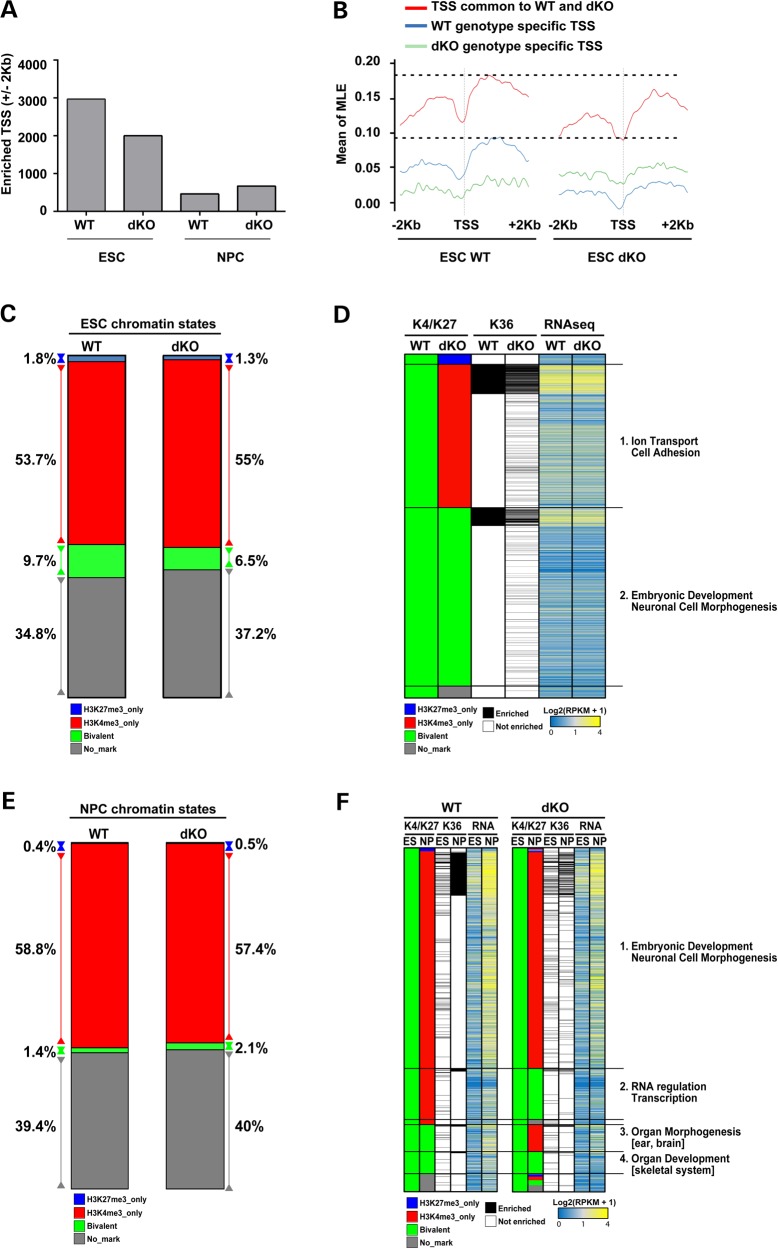
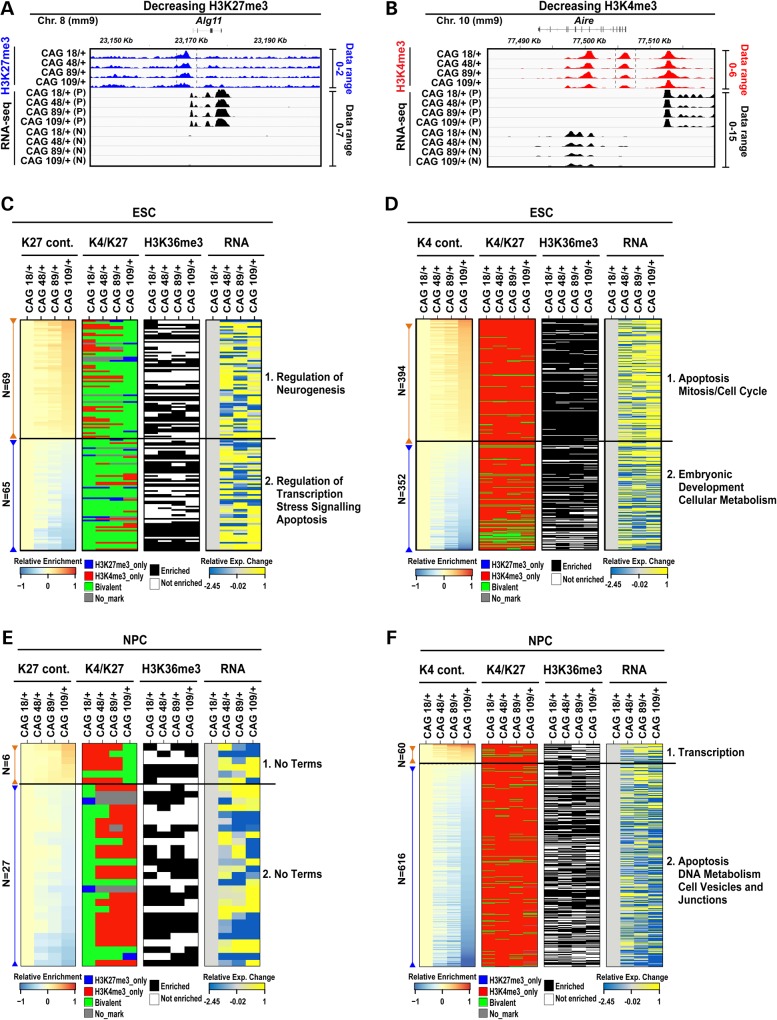
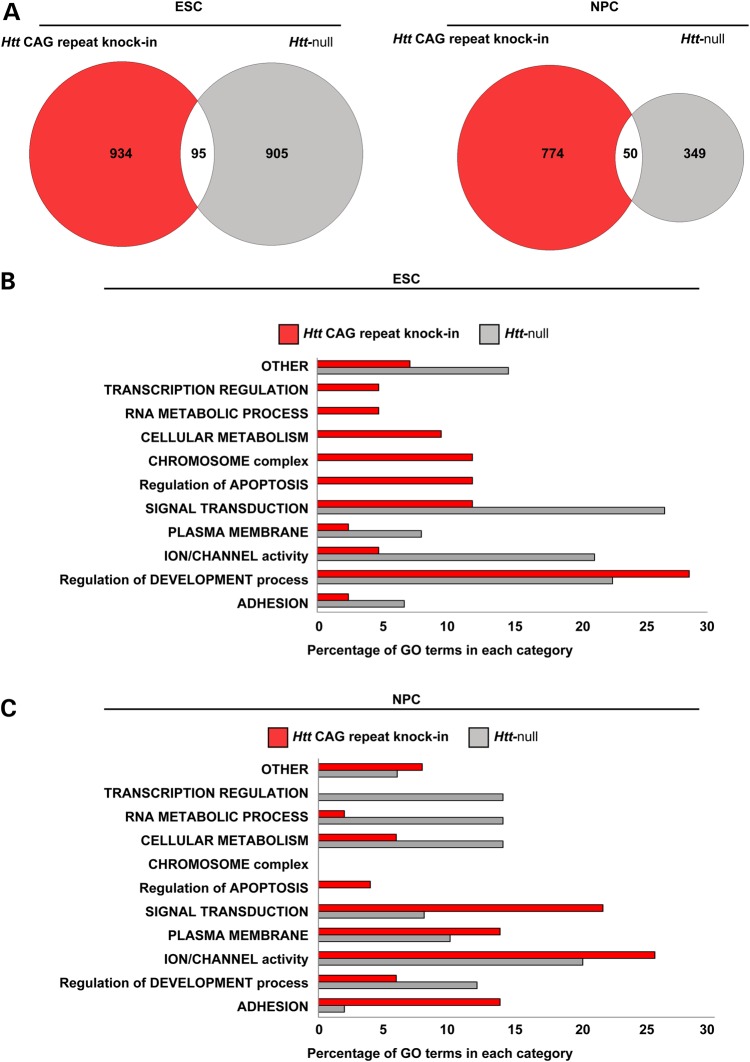
The CAG repeat expansion in the Huntington's disease gene HTT extends a polyglutamine tract in mutant huntingtin that enhances its ability to facilitate polycomb repressive complex 2 (PRC2). To gain insight into this dominant gain of function, we mapped histone modifications genome-wide across an isogenic panel of mouse embryonic stem cell (ESC) and neuronal progenitor cell (NPC) lines, comparing the effects of Htt null and different size Htt CAG mutations. We found that Htt is required in ESC for the proper deposition of histone H3K27me3 at a subset of 'bivalent' loci but in NPC it is needed at 'bivalent' loci for both the proper maintenance and the appropriate removal of this mark. In contrast, Htt CAG size, though changing histone H3K27me3, is prominently associated with altered histone H3K4me3 at 'active' loci. The sets of ESC and NPC genes with altered histone marks delineated by the lack of huntingtin or the presence of mutant huntingtin, though distinct, are enriched in similar pathways with apoptosis specifically highlighted for the CAG mutation. Thus, the manner by which huntingtin function facilitates PRC2 may afford mutant huntingtin with multiple opportunities to impinge upon the broader machinery that orchestrates developmentally appropriate chromatin status.


Figures

Figure 1.
Figure 1.
Members of the isogenic Htt null and Htt CAG-expansion ESC and NPC panels exhibit similar stage-appropriate morphological and molecular characteristics. (A) Schematic representation of the protocol by which mouse embryonic stem cells (ESC) develop into neuronal progenitor cells (NPC) through EBs and timed addition of retinoic acid (RA). (B and C) Phase contrast micrographs of wild-type (WT), Htt null Hdhex4/5/ex4/5 (dKO) and heterozygous Htt CAG knock-in HdhQ20/7, HdhQ50/7 HdhQ91/7 and HdhQ111/7 (CAG 18/+, 48/+, 89/+, 109/+) ESC lines showing colonies stained for alkaline phosphatase and the NPC lines derived from them displaying appropriate morphology with neurite extensions. (D and E) Images of cells, with DAPI stained nuclei to show proper Oct-4 expression in Htt wild-type, Htt null and Htt CAG knock-in ESC colonies and appropriate expression of Pax6 and Nestin neuroectodermal markers in the NPC for each genotype. (F and G) Bar graphs plot relative normalized mRNA expression levels of pluripotency marker genes Pou5f1 and Nanog encoding Oct-4 and Nanog and neuroectodermal marker genes Pax6 and Nes encoding Pax6 and Nestin as determined by RT-qPCR amplification assays. Error bars represent standard deviations from the mean of two biological and two technical replicates.
Figure 2.
Figure 2.
PRC2 core and accessory factors are similar in across the Htt allelic series. (A and B) Bar graphs plotting normalized relative mRNA levels of genes encoding PRC2 core subunits (Ezh2, Suz12, Eed and Rbbp4/RbAp48) determined by RT-qPCR amplification assays for wild-type (WT) and Htt null (dKO) ESC and NPC lines and (B) for the heterozygous Htt CAG knock-in HdhQ20/7, HdhQ50/7, HdhQ91/7, HdhQ111/7 (CAG 18/+, 48/+, 89/+ 109/+) ESC and NPC lines. (C) Immunoblot analyses of wild-type (WT) and Htt null (dKO) and HdhQ20/7, HdhQ50/7, HdhQ91/7, HdhQ111/7 (CAG 18/+, 48/+, 89/+ 109/+) ESC and NPC lines. The band of normal mouse huntingtin (7 glutamine tract) is absent in Htt null cells and across the CAG knock-in series the normal mouse huntingtin band and the more slowly migrating mutant huntingtin bands are progressively separated with increasing size of the latter's polyglutamine tract (comprising 20, 50, 91 and 111 glutamines, respectively). The bands of Ezh2 and Suz12 and β-actin (Actb) are detected in all of the lines. (D) Quantification of Esh2 and Suz12 immunoreactive bands relative to β-actin using ImageJ software. The mean values determined in two independent biological replicates are plotted. Error bars represent the standard deviations from the mean. (E and F) Bar graphs plotting normalized relative mRNA levels of genes encoding PRC2-associated factors (Phf1, Mtf2, Ezh1, Aebp2, Phf19, Jarid2) determined by RT-qPCR amplification assays for wild-type (WT) and Htt null (dKO) ESC and NPC lines and (F) for the heterozygous Htt CAG knock-in HdhQ20/7, HdhQ50/7, HdhQ91/7, HdhQ111/7 (CAG 18/+, 48/+, 89/+ 109/+) ESC and NPC lines. Error bars represent standard deviations from the mean for two biological replicates and two technical replicates.
Figure 3.
Figure 3.
Hoxb cluster illustrating genome-wide ChIP-seq and RNA-seq analyses. A snapshot of the IGV (http://broadinstitute.org) genome browser view at the location of the developmentally regulated Hoxb cluster (mouse chromosome 11qD) shows the ChIP-seq library-size normalized reads density (see Materials and Methods) for histone H3K27me3, histone H3K4me3 and histone H3K36me3 across the Htt wild-type, Htt null and the four Htt CAG knock-in ESC lines and for the NPC derived from them. Also shown are the RNA-seq reads density with the + strand (P) and – strand (N) indicated. Library-size normalized reads density data range for each histone modification and RNA-seq datasets are indicated on the right side of the tracks. For all six genotypes, after neural induction, the level of histone H3K27me3 at the gene TSSs is decreased with increased enrichment of histone H3K4me3 that is concomitant with RNA expression and enrichment of histone H3K36me3 across the gene bodies, thereby indicating comparable pluripotency and neural differentiation status for the members of the isogenic panel. Additional QC results for the ChIP-seq and RNA-seq datasets are provided in Supplementary Material, Figures S1, S2A and B.
Figure 4.
Figure 4.
Htt null mutation predominantly affects histone H3K27me3 at ‘bivalent’ loci in ESC and NPC. (A) Bar graph of the total number of TSS with histone H3K27me3 enrichment (scaled ChIP read counts over input control using threshold 4 as described in Materials and Methods) in a region of ±2 kb around the TSS, for the Htt wild-type (WT) and Htt null (dKO) ESC and NPC lines. Supplementary Material, Figure S3C and D presents the TSS data for all of the other assessed histone marks for all of the members of the isogenic Htt allelic ESC and NPC series. (B) Metagene profiles displaying the average of TSS histone H3K27me3 enrichment (scaled ChIP read counts over input control exceeding threshold 3—see also Materials and Methods) in a region of ±2 kb around the TSS in Htt wild-type and Htt null ESC. TSS enriched for H3K27me3 in both genotypes are depicted in red. TSS enriched only in wild-type are given in blue. TSS enriched only in Htt null ES are depicted in green. Y axis shows mean of smoothed maximum likelihood enrichment estimates (MLE) for the groups of genes in each category (red, blue and green). (C) Bar plot depicting the fraction (as percentage) of the total TSS (N = 30 489) analyzed that are classified as ‘repressed’ (histone H3K27me3 only), ‘active’ (histone H3K4me3 only) or ‘bivalent’ (histone H3K27me3 and histone H3K4me3) for Htt wild-type (WT) and Htt null (dKO) ESC lines. (D) Composite heatmap plotting (in rows) the 2949 loci with TSS classified in Htt wild-type (WT) ESC as ‘bivalent’ to illustrate their chromatin status in Htt null (dKO) ESC. The adjacent columns show the corresponding histone H3K36me3 enrichment calculated over the gene body and the RNA-seq expression levels as Log2(RPKM+1) values. The major GO terms highlighted by pathways analyses for the subsets of loci with Htt null sensitive TSS enrichment (Category 1) and Htt null insensitive TSS enrichment (Category 2) are given (further details on the categories are provided in the Results). (E) Bar plot depicting the fraction (as percentage) of the total TSS (N = 30 489) analyzed that are classified as ‘repressed’ (histone H3K27me3 only), ‘active’ (histone H3K4me3 only) or ‘bivalent’ (histone H3K27me3 and histone H3K4me3) for Htt wild-type (WT) and Htt null (dKO) NPC lines. (F) Composite heatmap plotting (in rows) the 1525 TSS that are classified as ‘bivalent’ in both Htt wild-type (WT) ESC and Htt null (dKO) ESC with the adjacent column indicating their chromatin status in their cognate NPC line. The corresponding paired ESC and NPC histone H3K36me3 enrichment and RNA expression levels, as Log2(RPKM+1) values, are in the adjacent columns. The major GO terms highlighted by pathways analyses for the subsets of loci with Htt null insensitive TSS enrichment (Categories 1 and 4) or Htt null sensitive TSS enrichment (Categories 2 and 3) are given (further details on the categories are provided in the Results). Supplementary Material, Figure S3 reports ChIP-qPCR confirmation of selected Htt null TSS changes in ESC and NPC.
Figure 5.
Figure 5.
Htt CAG expansion yields pleiotropic chromatin changes in ESC and NPC. Two illustrative IGV snapshots at two genomic locations presenting decreasing H3K27me3 (A) and decreasing H3K4me3 (B) enrichments show the ChIP-seq library-size normalized reads (RPKM) for histone H3K27me3 or histone H3K4me3 across the four Htt CAG knock-in ESC lines. Vertical dashed lines indicate the ±2 kb region around the TSS considered for the evaluation of the histone modifications enrichment. Also shown are the RNA-seq reads (RPKM) with the + strand (P) and – strand (N) indicated. Library-size normalized RPKM data range for each histone modification and RNA-seq datasets are indicated on the right side of the tracks. The level of histone H3K27me3 and histone H3K4me3 at the specific TSS is decreased with increasing Htt CAG size and this change is concomitant with RNA expression alterations: specifically, increasing RNA levels were observed following histone H3K27me3 decreased enrichment (A panel, Alg11 gene), while decreasing RNA levels were identified following decreased histone H3K4me3 enrichment (B panel, Aire gene). Composite heatmaps plotting the loci (rows) with TSS that exhibit continuously (cont.) increasing (brown) or decreasing (blue) levels of histone H3K27me3 enrichment (C and E) or histone H3K4me3 enrichment (D and F) in the CAG knock-in HdhQ20/7, HdhQ50/7, HdhQ91/7, HdhQ111/7 (CAG 18/+, 48/+, 89/+, 109/+) ESC (C and D) and NPC lines (E and F), displayed by ranking of their library-size normalized ChIP enrichment relative to that of the CAG 18/+ ESC line (enrichment score). The respective chromatin status of each TSS by histone code classification as ‘active’, ‘bivalent’ or ‘repressed’ and the respective enrichment of histone H3K36me3 and RNA-seq expression levels are plotted in the adjacent sets of columns. The loci chosen exhibit at least >1 RPKM in at least one Htt CAG knock-in sample. RNA-seq data are reported as relative log2(RPKM+1) ratio of over CAG 18/+ ESC line and standardized by dividing these values over standard deviation across the knock-in samples. The major GO terms highlighted by pathway analyses for the subsets of loci with the TSS histone mark enrichment that increases (Category 1) or decreases (Category 2) with Htt CAG size are given (further details on the categories are provided in the Results). Supplementary Material, Figure S4 reports ChIP-qPCR confirmation of progressive TSS enrichment with Htt CAG size.
Figure 6.
Figure 6.
Comparison of the biological states forecast by the chromatin landscapes of Htt CAG knock-in and Htt null ESC and NPC. (A) Venn diagrams showing the modest intersection of the two genome-wide gene sets that are delineated either by histone H3K27me3 and histone H3K4me3 enrichment that conforms to HD genetic criteria in Htt CAG knock-in ESC and NPC lines (red) or, alternatively, by enrichment levels that are changed in Htt null ESC and NPC lines compared with their wild-type counterparts (gray). (B) Bar graph summarizing the results of DAVID pathways analysis for the Htt CAG- and Htt null-delineated ESC gene sets (red and gray, respectively), such that the proportion of significant Biological Process, Molecular Functions, Cellular Component and KEGG terms in any given general category is plotted as percentage of the total for each dataset. (C) Bar graph is same as in B, but for NPC samples.

References

    1. Rosas H.D., Koroshetz W.J., Chen Y.I., Skeuse C., Vangel M., Cudkowicz M.E., Caplan K., Marek K., Seidman L.J., Makris N., et al. (2003) Evidence for more widespread cerebral pathology in early HD: an MRI-based morphometric analysis. Neurology, 60, 1615–1620. - PubMed
    1. Vonsattel J.P., Myers R.H., Stevens T.J., Ferrante R.J., Bird E.D., Richardson E.P., Jr. (1985) Neuropathological classification of Huntington’s disease. J. Neuropathol. Exp. Neurol., 44, 559–577. - PubMed
    1. 1993) A novel gene containing a trinucleotide repeat that is expanded and unstable on Huntington’s disease chromosomes. The Huntington’s Disease Collaborative Research Group. Cell, 72, 971–983. - PubMed
    1. Lee J.M., Ramos E.M., Lee J.H., Gillis T., Mysore J.S., Hayden M.R., Warby S.C., Morrison P., Nance M., Ross C.A., et al. (2012) CAG repeat expansion in Huntington disease determines age at onset in a fully dominant fashion. Neurology, 78, 690–695. - PMC - PubMed
    1. An M.C., Zhang N., Scott G., Montoro D., Wittkop T., Mooney S., Melov S., Ellerby L.M. (2012) Genetic correction of Huntington’s disease phenotypes in induced pluripotent stem cells. Cell Stem Cell, 11, 253–263. - PMC - PubMed

Publication types

MeSH terms