

Growth rate analysis and efficient experimental design for tumor xenograft studies
- PMID: 25574127
- PMCID: PMC4264612
- DOI: 10.4137/CIN.S13974
Growth rate analysis and efficient experimental design for tumor xenograft studies
Abstract
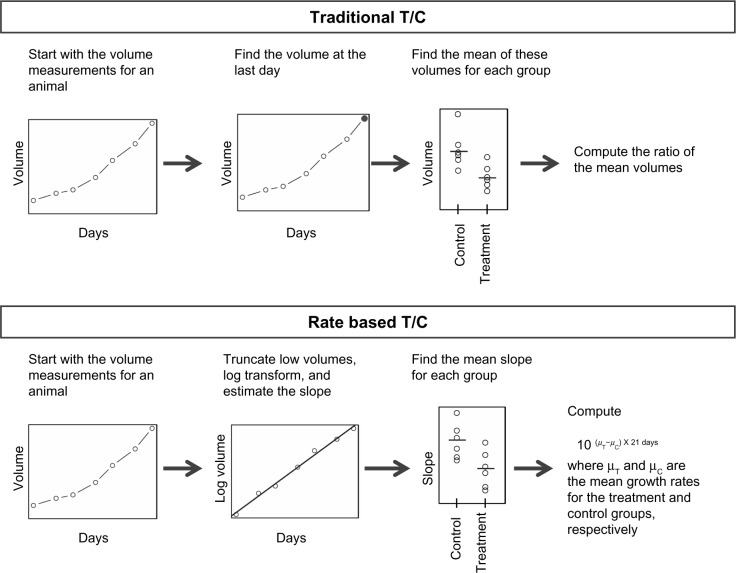
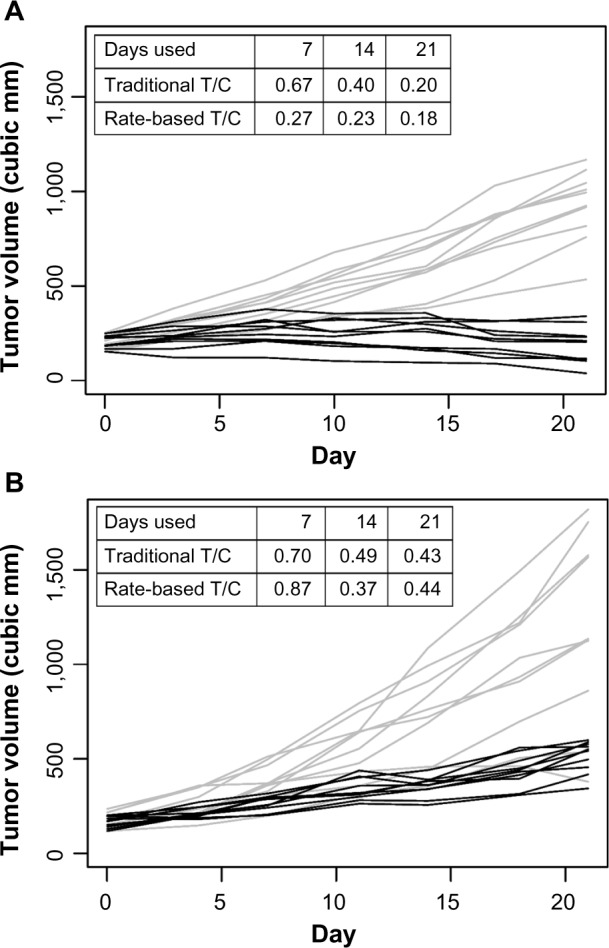
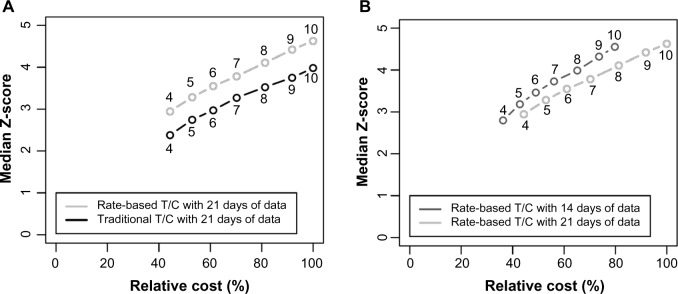
Human tumor xenograft studies are the primary means to evaluate the biological activity of anticancer agents in late-stage preclinical drug discovery. The variability in the growth rate of human tumors established in mice and the small sample sizes make rigorous statistical analysis critical. The most commonly used summary of antitumor activity for these studies is the T/C ratio. However, alternative methods based on growth rate modeling can be used. Here, we describe a summary metric called the rate-based T/C, derived by fitting each animal's tumor growth to a simple exponential model. The rate-based T/C uses all of the data, in contrast with the traditional T/C, which only uses a single measurement. We compare the rate-based T/C with the traditional T/C and assess their performance through a bootstrap analysis of 219 tumor xenograft studies. We find that the rate-based T/C requires fewer animals to achieve the same power as the traditional T/C. We also compare 14-day studies with 21-day studies and find that 14-day studies are more cost efficient. Finally, we perform a power analysis to determine an appropriate sample size.
Keywords: C; T; design; xenograft.
Figures
References
-
- Sausville EA, Burger AM. Contributions of human tumor xenografts to anticancer drug development. Cancer Res. 2006;66:3351–4. - PubMed
-
- Ma DL, Liu LJ, Leung KH, et al. Antagonizing STAT3 dimerization with a rhodium (III) complex. Angew Chem Int Ed Engl. 2014;53(35):9178–82. - PubMed
-
- Leung CH, Zhong HJ, Yang H, et al. A metal-based inhibitor of tumor necrosis factor-α. Angew Chem Int Ed Engl. 2012;51:9010–4. - PubMed
Publication types
LinkOut - more resources
Full Text Sources
Other Literature Sources
