

Fast monitoring of in-vivo conformational changes in myosin using single scan polarization-SHG microscopy
- PMID: 25574444
- PMCID: PMC4285611
- DOI: 10.1364/BOE.5.004362
Fast monitoring of in-vivo conformational changes in myosin using single scan polarization-SHG microscopy
Abstract
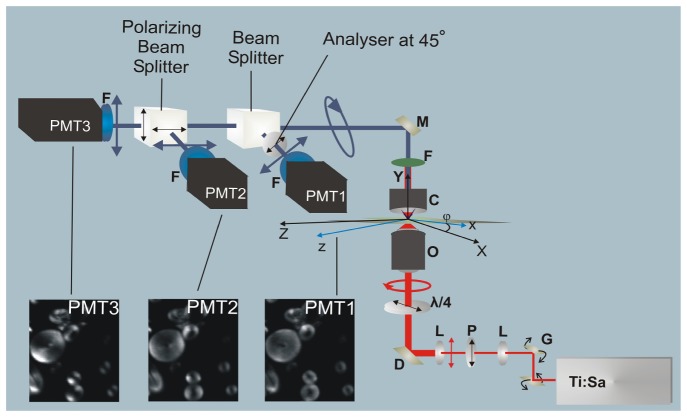
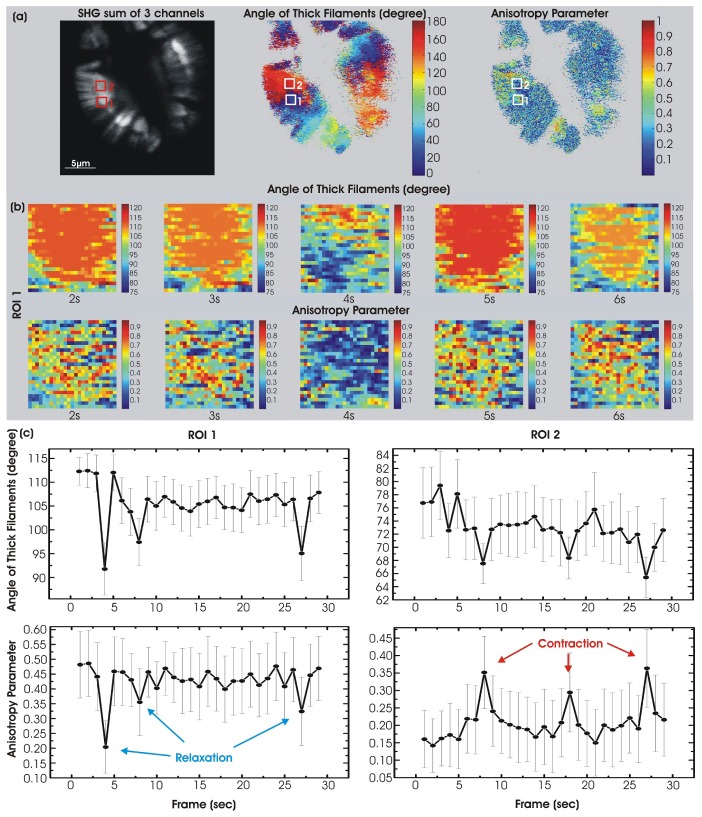
Fast imaging of molecular changes under high-resolution and label-free conditions are essential for understanding in-vivo processes, however, current techniques are not able to monitor such changes in real time. Polarization sensitive second harmonic generation (PSHG) imaging is a minimally invasive optical microscopy technique capable of quantifying molecular conformational changes occurring below the diffraction limit. Up to now, such information is generally retrieved by exciting the sample with different linear polarizations. This procedure requires the sample to remain static during measurements (from a few second to minutes), preventing the use of PSHG microscopy from studying moving samples or molecular dynamics in living organisms. Here we demonstrate an imaging method that is one order of magnitude faster than conventional PSHG. Based on circular polarization excitation and instantaneous polarimetry analysis of the second harmonic signal generated in the tissue, the method is able to instantaneously obtain molecular information within a pixel dwell time. As a consequence, a single scan is only required to retrieve all the information. This allowed us to perform PSHG imaging in moving C. elegans, monitoring myosin's dynamics during the muscular contraction and relaxation. Since the method provides images of the molecular state, an unprecedented global understanding of the muscles dynamics is possible by correlating changes in different regions of the sample.
Keywords: (180.4315) Nonlinear microscopy; (190.2620) Harmonic generation and mixing.
Figures
Similar articles
-
Comparison of Different Polarization Sensitive Second Harmonic Generation Imaging Techniques.Methods Protoc. 2019 Jun 7;2(2):49. doi: 10.3390/mps2020049. Methods Protoc. 2019. PMID: 31181703 Free PMC article.
-
Fast image analysis in polarization SHG microscopy.Opt Express. 2010 Aug 2;18(16):17209-19. doi: 10.1364/OE.18.017209. Opt Express. 2010. PMID: 20721110
-
Effect of molecular organization on the image histograms of polarization SHG microscopy.Biomed Opt Express. 2012 Oct 1;3(10):2681-93. doi: 10.1364/BOE.3.002681. Epub 2012 Sep 28. Biomed Opt Express. 2012. PMID: 23082306 Free PMC article.
-
Examination of Collagen Structure and State by the Second Harmonic Generation Microscopy.Biochemistry (Mosc). 2019 Jan;84(Suppl 1):S89-S107. doi: 10.1134/S0006297919140062. Biochemistry (Mosc). 2019. PMID: 31213197 Review.
-
Protein conformation and molecular order probed by second-harmonic-generation microscopy.J Biomed Opt. 2012 Jun;17(6):060901. doi: 10.1117/1.JBO.17.6.060901. J Biomed Opt. 2012. PMID: 22734730 Review.
Cited by
-
Polarimetric second harmonic generation microscopy of partially oriented fibers II: Imaging study.Biophys J. 2023 Oct 3;122(19):3937-3949. doi: 10.1016/j.bpj.2023.08.015. Epub 2023 Aug 23. Biophys J. 2023. PMID: 37621088 Free PMC article.
-
PSHG-TISS: A collection of polarization-resolved second harmonic generation microscopy images of fixed tissues.Sci Data. 2022 Jul 2;9(1):376. doi: 10.1038/s41597-022-01477-1. Sci Data. 2022. PMID: 35780180 Free PMC article.
-
Polarization-resolved second harmonic microscopy of skeletal muscle in sepsis.Biomed Opt Express. 2018 Nov 19;9(12):6350-6358. doi: 10.1364/BOE.9.006350. eCollection 2018 Dec 1. Biomed Opt Express. 2018. PMID: 31065433 Free PMC article.
-
Functional second harmonic generation microscopy probes molecular dynamics with high temporal resolution.Biomed Opt Express. 2016 Jan 15;7(2):525-41. doi: 10.1364/BOE.7.000525. eCollection 2016 Feb 1. Biomed Opt Express. 2016. PMID: 26977360 Free PMC article.
-
Translational label-free nonlinear imaging biomarkers to classify the human corneal microstructure.Biomed Opt Express. 2015 Jul 8;6(8):2803-18. doi: 10.1364/BOE.6.002803. eCollection 2015 Aug 1. Biomed Opt Express. 2015. PMID: 26309745 Free PMC article.
References
LinkOut - more resources
Full Text Sources
Other Literature Sources
Research Materials