. 2015 Jan 7;16(1):1266-92.
doi: 10.3390/ijms16011266.

Molecular targeting of the oncoprotein PLK1 in pediatric acute myeloid leukemia: RO3280, a novel PLK1 inhibitor, induces apoptosis in leukemia cells

Affiliations

Molecular targeting of the oncoprotein PLK1 in pediatric acute myeloid leukemia: RO3280, a novel PLK1 inhibitor, induces apoptosis in leukemia cells

Na-Na Wang et al. Int J Mol Sci. .

Abstract

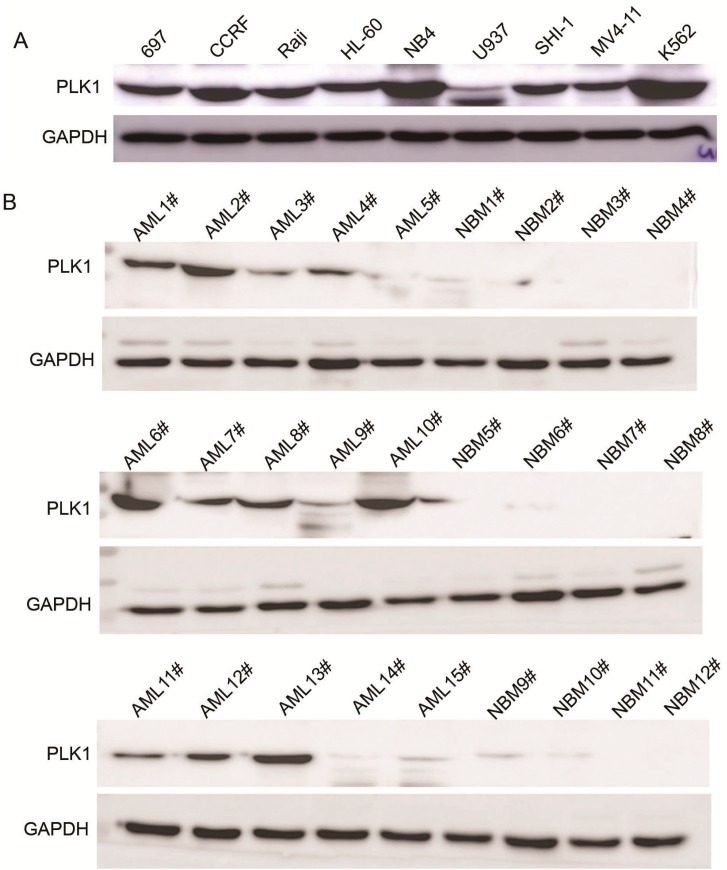
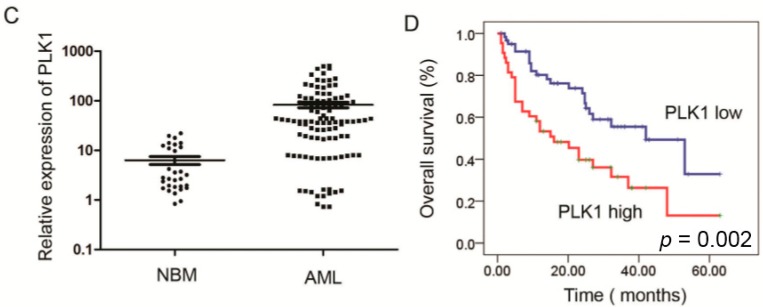
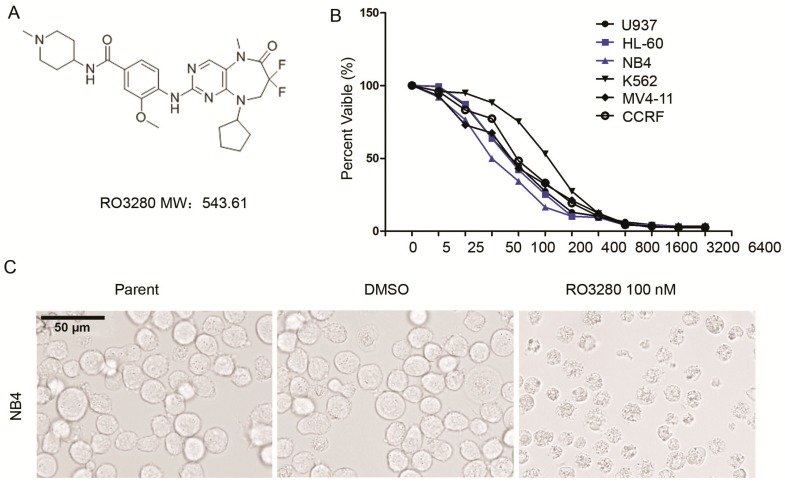
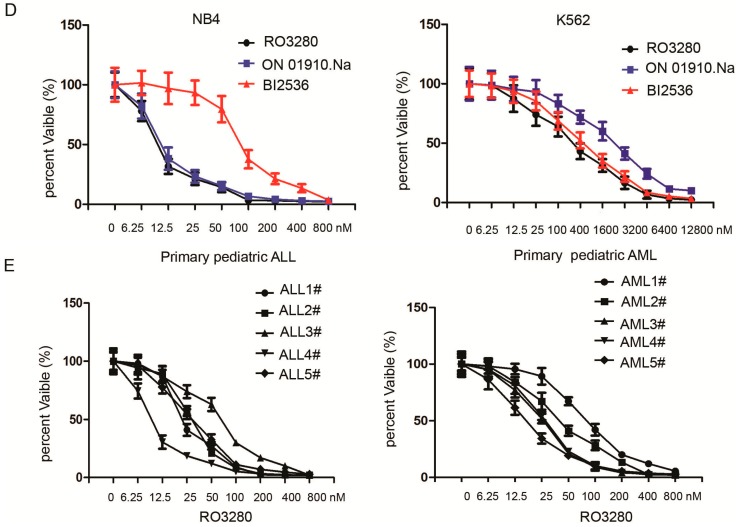
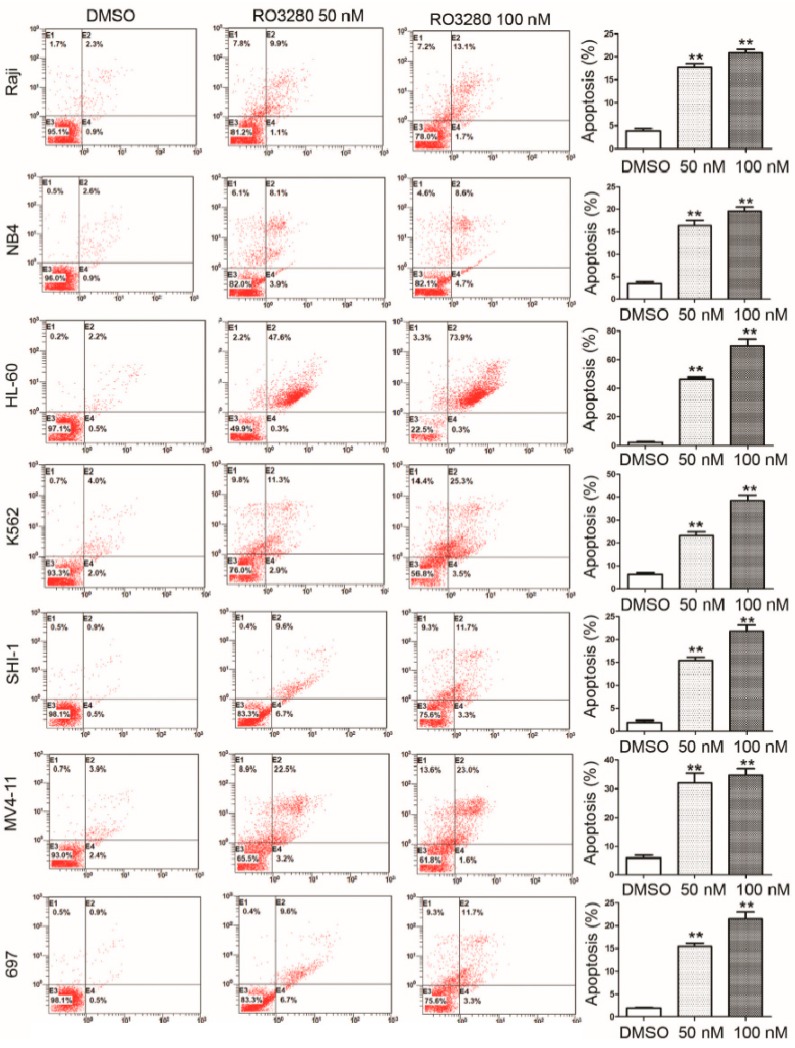
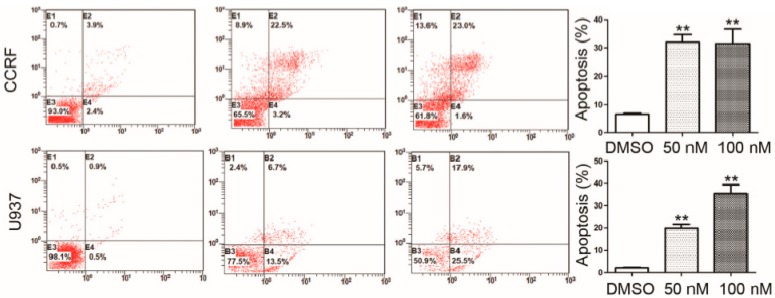
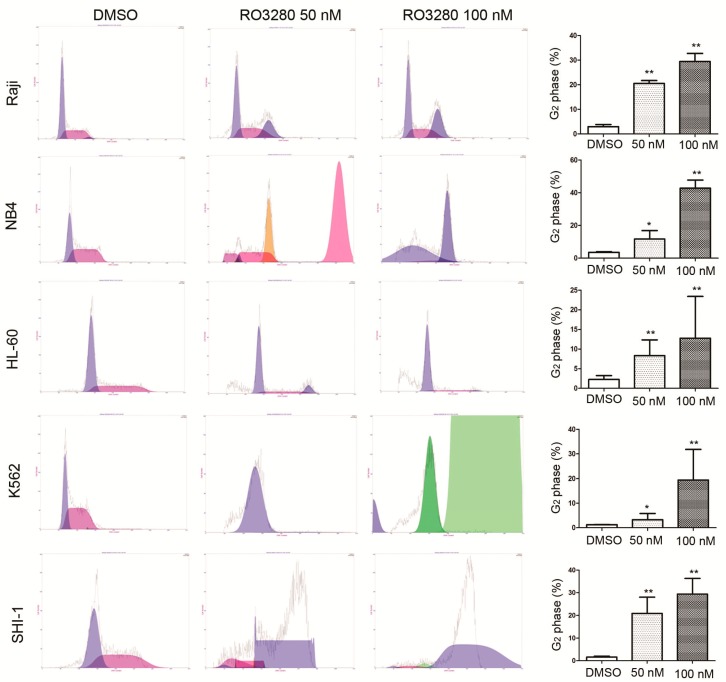
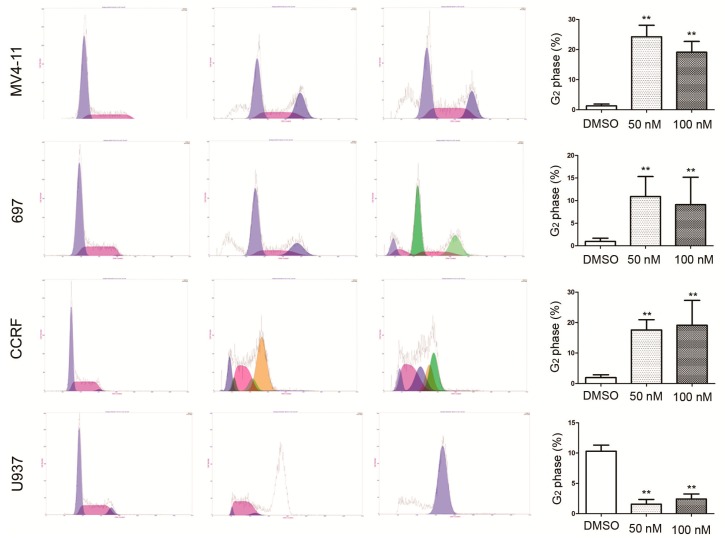
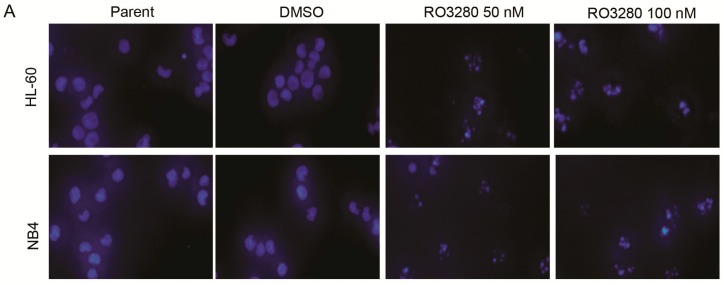
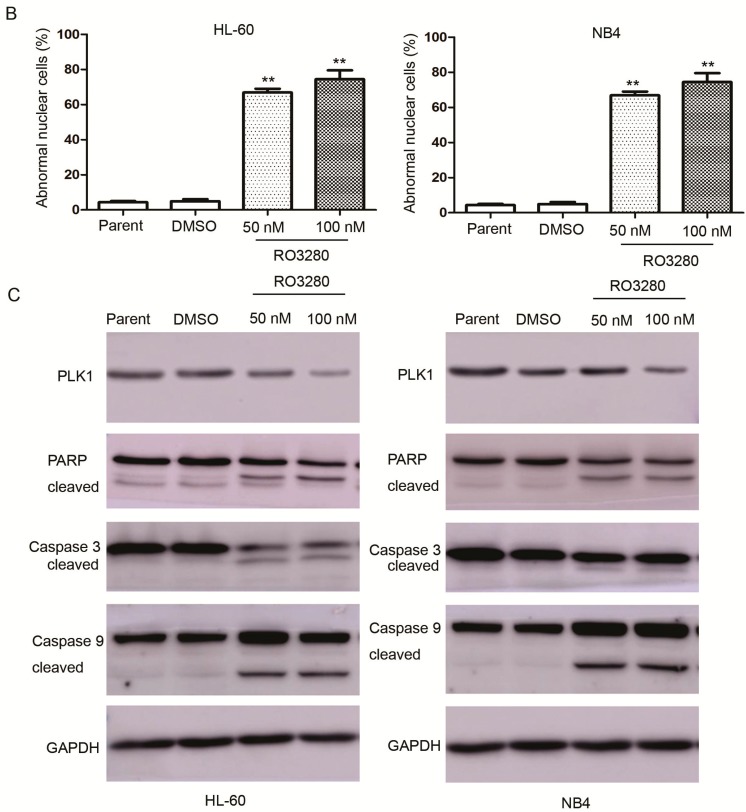
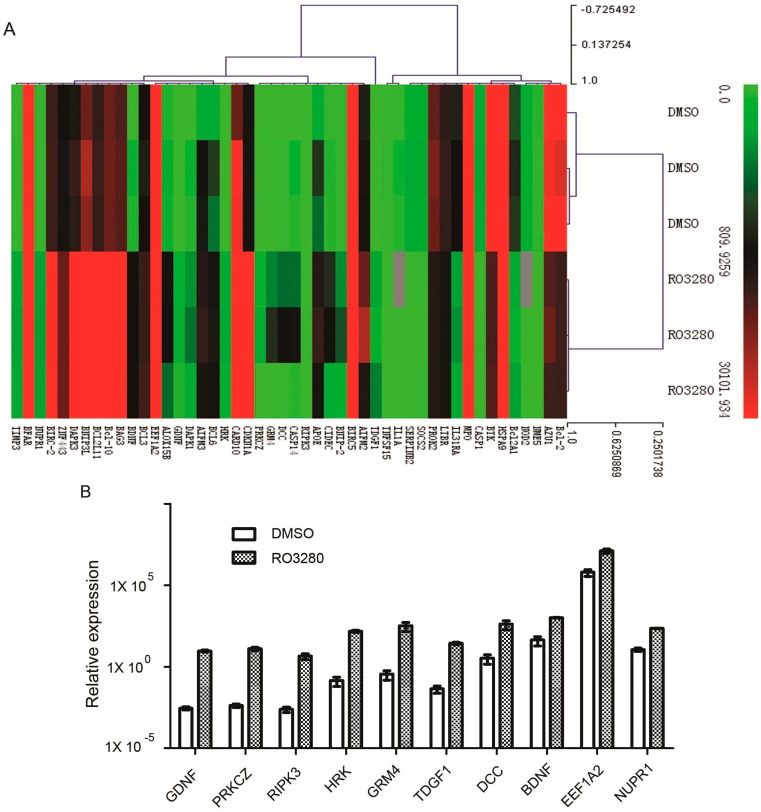
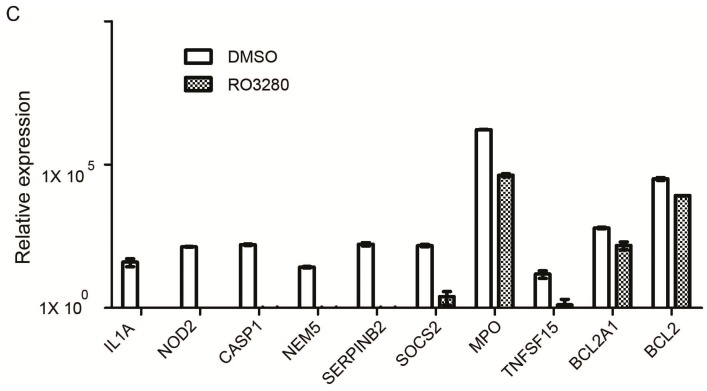
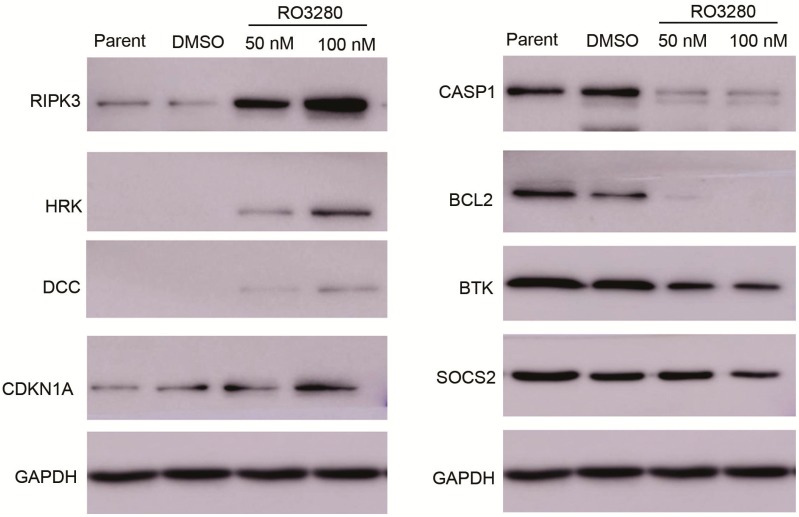
Polo-like kinase 1 (PLK1) is highly expressed in many cancers and therefore a biomarker of transformation and potential target for the development of cancer-specific small molecule drugs. RO3280 was recently identified as a novel PLK1 inhibitor; however its therapeutic effects in leukemia treatment are still unknown. We found that the PLK1 protein was highly expressed in leukemia cell lines as well as 73.3% (11/15) of pediatric acute myeloid leukemia (AML) samples. PLK1 mRNA expression was significantly higher in AML samples compared with control samples (82.95 ± 110.28 vs. 6.36 ± 6.35; p < 0.001). Kaplan-Meier survival analysis revealed that shorter survival time correlated with high tumor PLK1 expression (p = 0.002). The 50% inhibitory concentration (IC50) of RO3280 for acute leukemia cells was between 74 and 797 nM. The IC50 of RO3280 in primary acute lymphocytic leukemia (ALL) and AML cells was between 35.49 and 110.76 nM and 52.80 and 147.50 nM, respectively. RO3280 induced apoptosis and cell cycle disorder in leukemia cells. RO3280 treatment regulated several apoptosis-associated genes. The regulation of DCC, CDKN1A, BTK, and SOCS2 was verified by western blot. These results provide insights into the potential use of RO3280 for AML therapy; however, the underlying mechanisms remain to be determined.


Figures

Figure 1
Figure 1
Expression of PLK1 is upregulated in AML cells and pediatric AML patients (A) Western blot analysis showing PLK1 protein expression in nine leukemia cell lines; (B) Western blot analysis showing PLK1 protein expression in 15 pediatric AML samples and 12 NBM samples; (C) Real-time PCR analysis of the PLK1 mRNA transcript levels in 105 pediatric AML samples and 30 NBM/ITP (normal bone marrow/idiopathic thrombocytopenic purpura) control samples; and (D) Kaplan-Meier survival analysis of 105 pediatric AML patients comparing high and low PLK1 expression (p = 0.002).
Figure 1
Figure 1
Expression of PLK1 is upregulated in AML cells and pediatric AML patients (A) Western blot analysis showing PLK1 protein expression in nine leukemia cell lines; (B) Western blot analysis showing PLK1 protein expression in 15 pediatric AML samples and 12 NBM samples; (C) Real-time PCR analysis of the PLK1 mRNA transcript levels in 105 pediatric AML samples and 30 NBM/ITP (normal bone marrow/idiopathic thrombocytopenic purpura) control samples; and (D) Kaplan-Meier survival analysis of 105 pediatric AML patients comparing high and low PLK1 expression (p = 0.002).
Figure 2
Figure 2
RO3280 inhibits the growth of acute leukemia cells. (A) Molecular structure of RO3280; (B) Viability and IC50 analysis of RO3280 in six leukemia cells. The following are the determined RO3280 IC50s: U937 186 nM, HL60 175 nM, NB4 74 nM, K562 797 nM, MV4-11 120 nM and CCRF 162 nM; (C) Micrographs were taken of NB4 cells treated with RO3280 100 nM or DMSO (scale bar = 50 μm); (D) The IC50 of three PLK1 inhibitors, RO3280, ON 01910.Na and BI2536, was analyzed in NB4 and K562 cells. IC50 in NB4 cells: RO3280 13.45 nM, ON 01910. Na 13.02 nM, and BI2536 87.65 nM. IC50 in K562 cells: RO3280 301 nM, ON 01910. Na 1606 nM, and BI2536 is 448 nM; and (E) The IC50 of RO3280 in primary acute lymphocytic leukemia (ALL) and AML cells was also analyzed: ALL 35.49–110.76 nM and AML 52.80–147.50 nM. Cell proliferation was calculated as a percentage of the DMSO treated control wells. The IC50 values were derived after plotting proliferation values on a logarithmic curve. Experiments were performed in quadruplicate and repeated twice.
Figure 2
Figure 2
RO3280 inhibits the growth of acute leukemia cells. (A) Molecular structure of RO3280; (B) Viability and IC50 analysis of RO3280 in six leukemia cells. The following are the determined RO3280 IC50s: U937 186 nM, HL60 175 nM, NB4 74 nM, K562 797 nM, MV4-11 120 nM and CCRF 162 nM; (C) Micrographs were taken of NB4 cells treated with RO3280 100 nM or DMSO (scale bar = 50 μm); (D) The IC50 of three PLK1 inhibitors, RO3280, ON 01910.Na and BI2536, was analyzed in NB4 and K562 cells. IC50 in NB4 cells: RO3280 13.45 nM, ON 01910. Na 13.02 nM, and BI2536 87.65 nM. IC50 in K562 cells: RO3280 301 nM, ON 01910. Na 1606 nM, and BI2536 is 448 nM; and (E) The IC50 of RO3280 in primary acute lymphocytic leukemia (ALL) and AML cells was also analyzed: ALL 35.49–110.76 nM and AML 52.80–147.50 nM. Cell proliferation was calculated as a percentage of the DMSO treated control wells. The IC50 values were derived after plotting proliferation values on a logarithmic curve. Experiments were performed in quadruplicate and repeated twice.
Figure 3
Figure 3
Annexin V analysis of apoptosis induced by RO3280 in acute leukemia cells. Annexin V staining of cells following a 24 h treatment with RO3280 at 50 or 100 nM compared with DMSO control mock treatment. All these analyses were repeated three times. ** p < 0.01.
Figure 3
Figure 3
Annexin V analysis of apoptosis induced by RO3280 in acute leukemia cells. Annexin V staining of cells following a 24 h treatment with RO3280 at 50 or 100 nM compared with DMSO control mock treatment. All these analyses were repeated three times. ** p < 0.01.
Figure 4
Figure 4
Cell cycle analysis of RO3280 induced cell cycle disorder in acute leukemia cells. Cell cycle analysis of nine leukemia cells treated for 24 h with RO3280 at 50 or 100 nM compared with DMSO control mock treatment. G2 phase of each group was analyzed and presented. All these analyses were repeated three times. * p < 0.05; ** p < 0.01. Left purple peak mean the G1 phase and right purple peak mean the G2 phase, red peak means the S phase; Pink, yellow and green peak mean the disorder of cell cycle.
Figure 4
Figure 4
Cell cycle analysis of RO3280 induced cell cycle disorder in acute leukemia cells. Cell cycle analysis of nine leukemia cells treated for 24 h with RO3280 at 50 or 100 nM compared with DMSO control mock treatment. G2 phase of each group was analyzed and presented. All these analyses were repeated three times. * p < 0.05; ** p < 0.01. Left purple peak mean the G1 phase and right purple peak mean the G2 phase, red peak means the S phase; Pink, yellow and green peak mean the disorder of cell cycle.
Figure 5
Figure 5
RO3280 induced DNA fragmentation and cleavage of apoptotic markers in acute leukemia cells. (A) Micrographs following Hoechst 33342 staining of cells treated with RO3280 (50 and 100 nM) for 24 h. This demonstrates the induction of DNA fragmentation and abnormal nuclear cell formation; (B) The abnormal nuclear cells were quantified and increased significantly with RO3280 treatment compared with mock treatment in both HL-60 and NB4 cells. ** p < 0.01; and (C) Western blot analysis of PARP, caspase-3, and caspase-9. After 24 h treatment with 50 or 100 nM RO3280, cleaved PARP and caspase-9 were detected in lysates from NB4 and HL-60 cells.
Figure 5
Figure 5
RO3280 induced DNA fragmentation and cleavage of apoptotic markers in acute leukemia cells. (A) Micrographs following Hoechst 33342 staining of cells treated with RO3280 (50 and 100 nM) for 24 h. This demonstrates the induction of DNA fragmentation and abnormal nuclear cell formation; (B) The abnormal nuclear cells were quantified and increased significantly with RO3280 treatment compared with mock treatment in both HL-60 and NB4 cells. ** p < 0.01; and (C) Western blot analysis of PARP, caspase-3, and caspase-9. After 24 h treatment with 50 or 100 nM RO3280, cleaved PARP and caspase-9 were detected in lysates from NB4 and HL-60 cells.
Figure 6
Figure 6
Real-time PCR array identifies genes implicated in the effect of RO3280 treatment. (A) Gene expression clustering of 370 key apoptosis genes in 50 nM RO3280-treated NB4 cells compared to DMSO-treated cells; (B) Relative expression of the most upregulated genes in RO3280-treated NB4 cells compared to DMSO-treated cells; and (C) Relative expression of the most downregulated genes in RO3280-treated NB4 cells compared to DMSO-treated cells.
Figure 6
Figure 6
Real-time PCR array identifies genes implicated in the effect of RO3280 treatment. (A) Gene expression clustering of 370 key apoptosis genes in 50 nM RO3280-treated NB4 cells compared to DMSO-treated cells; (B) Relative expression of the most upregulated genes in RO3280-treated NB4 cells compared to DMSO-treated cells; and (C) Relative expression of the most downregulated genes in RO3280-treated NB4 cells compared to DMSO-treated cells.
Figure 7
Figure 7
Western blot verification of real-time PCR array results. Western blot analysis of cells following a 24 h treatment with RO3280 at 50 or 100 nM compared with DMSO control mock treatment. The upregulation of DCC and CDKN1A and down regulation of BTK and SOCS2 in RO3280 treated cells. Protein lysates from treated cells were tested for expression levels by Western blot analysis.

References

    1. Jemal A., Thomas A., Murray T., Thun M. Cancer statistics. CA Cancer J. Clin. 2002;52:23–47. doi: 10.3322/canjclin.52.1.23. - DOI - PubMed
    1. Jabbour E., Cortes J., Ravandi F., O’Brien S., Kantarjian H. Targeted therapies in hematology and their impact on patient care: Chronic and acute myeloid leukemia. Semin. Hematol. 2013;50:271–283. doi: 10.1053/j.seminhematol.2013.09.006. - DOI - PMC - PubMed
    1. Miano M., Micalizzi C., Calvillo M., Dufour C. New targets in pediatric acute myeloid leukemia. Immunol. Lett. 2013;155:47–50. doi: 10.1016/j.imlet.2013.09.012. - DOI - PubMed
    1. Zhao Y., Huang H., Wei G. Novel agents and biomarkers for acute lymphoid leukemia. J. Hematol. Oncol. 2013;6:40. doi: 10.1186/1756-8722-6-40. - DOI - PMC - PubMed
    1. Moore A.S., Kearns P.R., Knapper S., Pearson A.D., Zwaan C.M. Novel therapies for children with acute myeloid leukaemia. Leukemia. 2013;27:1451–1460. doi: 10.1038/leu.2013.106. - DOI - PubMed

Publication types

MeSH terms