. 2015 Jan 9;10(1):e0115857.
doi: 10.1371/journal.pone.0115857. eCollection 2015.

Dynamics of actin waves on patterned substrates: a quantitative analysis of circular dorsal ruffles

Affiliations

Dynamics of actin waves on patterned substrates: a quantitative analysis of circular dorsal ruffles

Erik Bernitt et al. PLoS One. .

Erratum in

Abstract

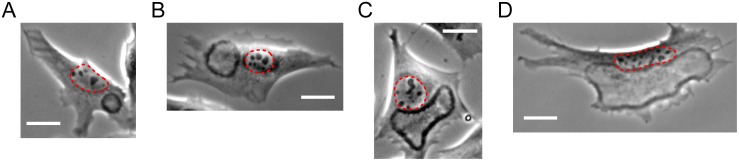
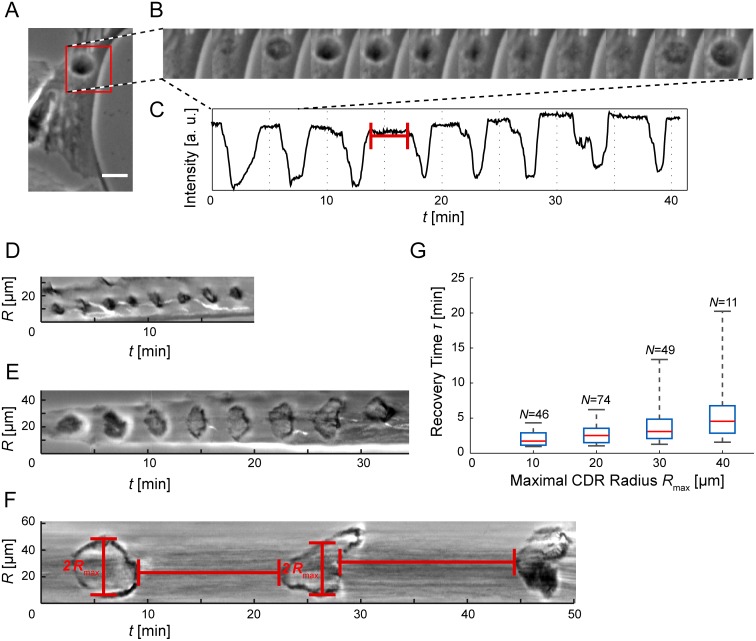
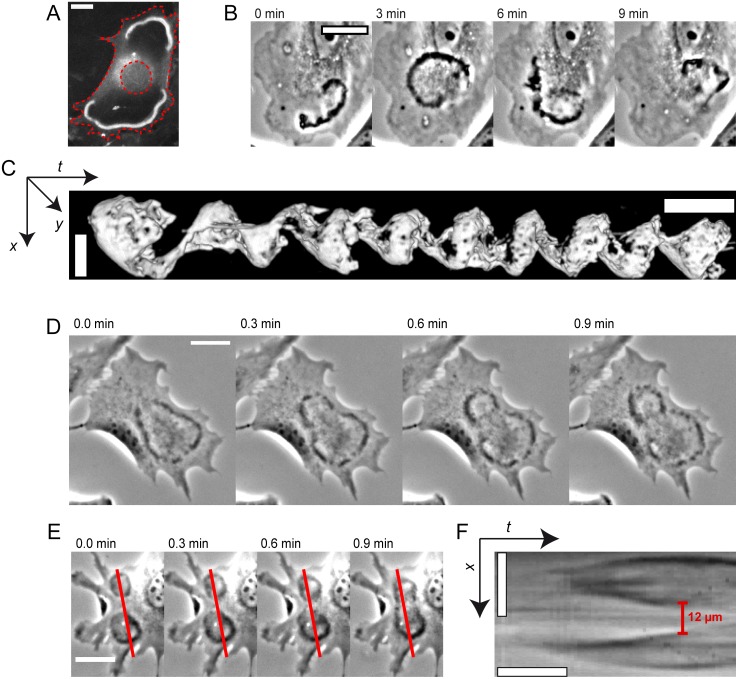
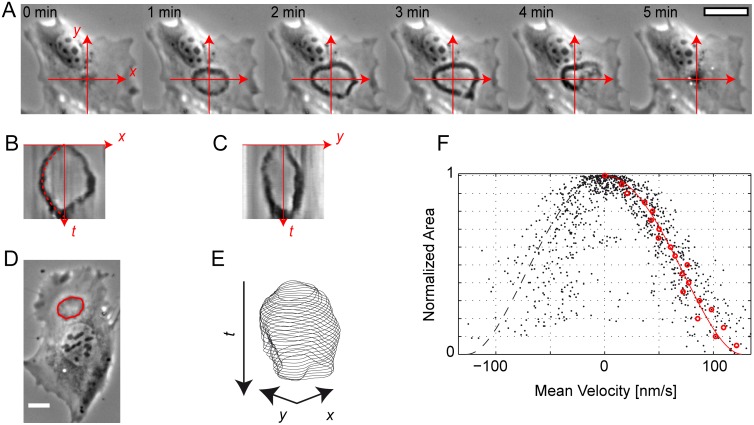
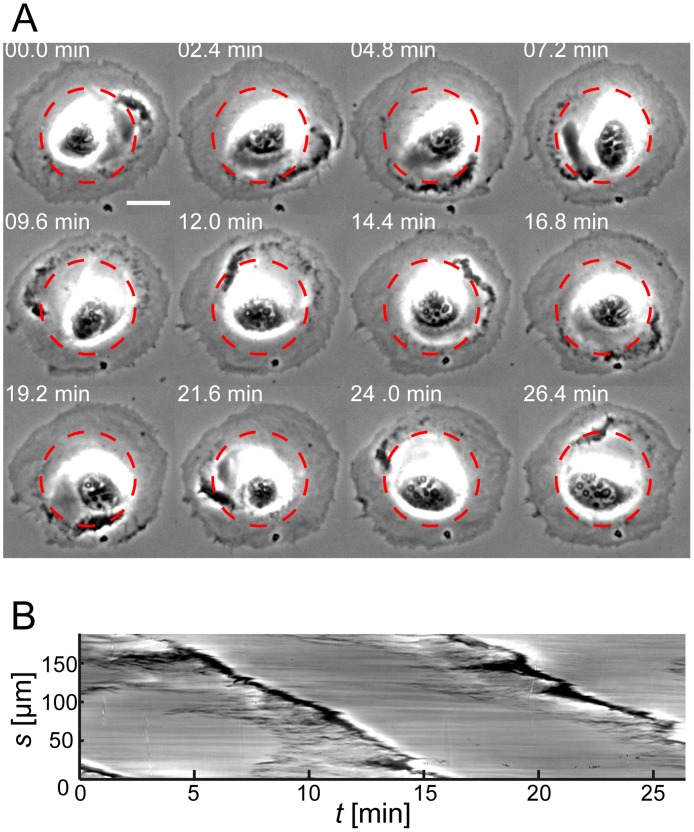
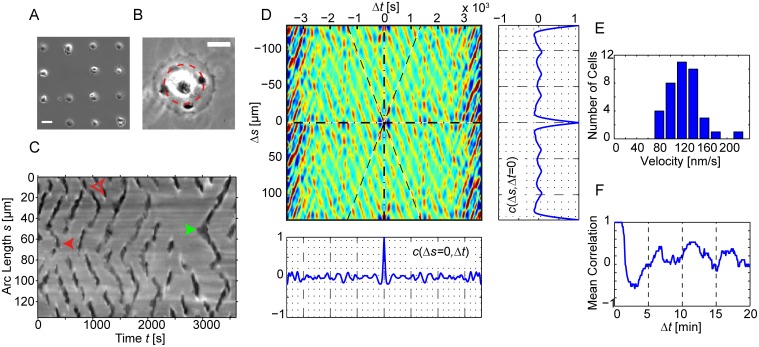
Circular Dorsal Ruffles (CDRs) have been known for decades, but the mechanism that organizes these actin waves remains unclear. In this article we systematically analyze the dynamics of CDRs on fibroblasts with respect to characteristics of current models of actin waves. We studied CDRs on heterogeneously shaped cells and on cells that we forced into disk-like morphology. We show that CDRs exhibit phenomena such as periodic cycles of formation, spiral patterns, and mutual wave annihilations that are in accord with an active medium description of CDRs. On cells of controlled morphologies, CDRs exhibit extremely regular patterns of repeated wave formation and propagation, whereas on random-shaped cells the dynamics seem to be dominated by the limited availability of a reactive species. We show that theoretical models of reaction-diffusion type incorporating conserved species capture partially the behavior we observe in our data.


Conflict of interest statement

Competing Interests: The authors have declared that no competing interests exist.

Figures

Figure 1
Figure 1. Effects of cell size and morphology on CDR morphology and dynamics.
CDRs usually avoid the nucleus region (encircled in red). Cell edge and nucleus therefore define a bounded region available for CDR propagation, which limits the maximal size CDRs can attain. In the panels A-D the size of this region is increasing from left to right. The isotropy of CDRs decreases with increasing CDR size, while the tendency to mimic cell morphology increases with CDR size. CDRs in small regions (A) cannot extend much, typically forming oscillatory reappearing objects of high isotropy. All scale bars correspond to 25 µm. See S1–S4 Movies (corresponding to panel A-D respectively) for the respective characteristic dynamics.
Figure 2
Figure 2. Oscillatory reappearing CDRs.
(A) CDRs under spatial confinement exhibit oscillatory patterns of pulsating re-appearance (scale bar: 25 µm, full sequence: S5 Movie). (B) Stills from the region of interest highlighted red in the time-lapse sequence At = 36 s). (C) A plot of the minimal intensity value of the ROI in A as a function of time shows CDR events as negative peaks and CDR-free periods, corresponding to the recovery time τ, as plateaus of high intensity. The ROI was smoothed with a Gaussian with σ = 2 µm prior to intensity sampling. (D-F) Kymographs of CDRs taken along lines crossing CDR origins (see Fig. 4A for illustration) show both the recovery time τ between successive events and their radial extension R max (cells not shown). (G) The recovery times increase with CDR size. The data was binned in R max-direction (box width: 10 µm) and plotted as boxes with whiskers (red lines: median, upper box edge: 75th percentile, lower box edge: 25th percentile). N values denote the number of observations. Note that oscillatory behavior was rare for large CDRs.
Figure 3
Figure 3. Overview of CDR phenomena.
(A) CDRs can become trapped close to cell edges; actin staining with pLifeAct–TagGFP2 reveals regions of actin depletion behind wavefronts (S6 Movie). Red dashed lines highlight cell edge and nucleus. (B) A CDR propagating as a spiral wave (S7 Movie). (C) Iso-surface visualization of the CDR in B as an x-y-t-projection (see S3 Fig. and S8 Movie). The CDR performed eight full rotations in approximately 70 minutes. (D) A CDR dividing into two arc-shaped wavefronts (S9 Movie). (E and F) Time-lapse sequence of two colliding CDRs and the corresponding kymograph respectively (S10 Movie). The red lines in E mark the position were kymographs where sampled. The CDR wavefronts mutually annihilate each other at a distance of approximately 12 µm before they actually make contact. All spatial scale bars correspond to 25 µm. Temporal scale bar in C: 10 minutes, temporal scale bar in F 1: minute.
Figure 4
Figure 4. Wavefront dynamics of opening and closing CDRs.
(A-C) A typical life course of a CDR exhibiting opening and closing (S11 Movie). The coordinate system in A is the basis for calculation of the kymographs shown in B and C. Together with time-lapse sequence A these kymographs show the dependency of CDR dynamics on cell features. CDR propagation without encounter of obstacles and absence of instability has a parabolic evolution of the CDR radius with time (red dashed line in B: empirical parabola fit). In positive x-direction, however, the wavefront becomes unstable and partially decays, leading to an asymmetric profile in kymograph B. (D and E) Using active contours, the wavefronts of CDRs can be tracked yielding sets of contours for each CDR (S12 Movie). (F) The contour mean velocity data of 13 CDRs as a function of the normalized area roughly follow one trajectory. Positive velocities correspond to CDR growth and negative velocities to CDR shrinking. Original data points are shown in black, red circles correspond to average velocities calculated using a box median of width 0.05 in normalized area. The red line is an empirical fit function used for extrapolation to a CDR area of zero. See the main text and the SI Methods in S1 Text for details. All spatial scale bars correspond to 25 µm.
Figure 5
Figure 5. CDR orbiting the nucleus of a cell of disk-morphology.
(A) Time-lapse sequence of a cell that had disk-like morphology without being plated on a micro protein patch. A CDR propagates between cell edge and cell nucleus, circling the nucleus almost twice (S13 Movie). (B) Sampling of the image intensity along the arc length of a circle (highlighted red in A) and as a function of time gives rise to a circular kymograph. The nearly constant slope in this kymograph indicates a constant lateral velocity (v = 0.21 µm/s) of the CDR. Scale bar in A: 25 µm.
Figure 6
Figure 6. Space-time correlations of CDRs on circular paths.
(A and B) Using microcontact printing, cells can be patterned into well-defined morphologies. (B) On disk-like cells CDRs propagate in lateral direction between the cell nucleus and the cell edge (S14 Movie). (C) Circular kymograph sampled at the red circle in (B). Waves propagating in lateral direction show up as dark stripes. “<“-shaped objects correspond to wave initiation (the green arrow highlights one example) and “>“-shaped objects to wave annihilation. The solid red arrow shows an example of mutual annihilation while the hollow red arrow marks an event in which one pulse survives the collision. (D) The apparent high regularity in slopes and frequency of occurrence in C is emphasized in an autocorrelation function cs, Δt). In this specific example we find propagation velocities of 0.10 µm/s and a typical period of 6 min between two CDR events at the same position (see the cut cs = 0, Δt) and F for the sample average). The cut cs, Δt = 0) emphasizes the dominant number of four DCRs at the same time on this cell. (E) A histogram of velocity data obtained from an autocorrelation analysis of 38 cells. The mean velocity is 0.12 (± 0.03) µm/s (± SD). (F) A cut through the average correlation function of the same 38 cells at constant position. The mean period between two CDR events at the same position is approximately 6 min. The scale bars in A and B correspond to 50 µm and 25 µm respectively. See S1 Text, Materials and Methods for details regarding the calculation of autocorrelation functions and derived values form these.

References

    1. Pollard TD, Borisy GG (2003) Cellular motility driven by assembly and disassembly of actin filaments. Cell 112: 453–465. 10.1016/S0092-8674(03)00120-X - DOI - PubMed
    1. Allard J, Mogilner A (2013) Traveling waves in actin dynamics and cell motility. Curr Opin Cell Biol 25: 107–115. 10.1016/j.ceb.2012.08.012 - DOI - PMC - PubMed
    1. Bretschneider T, Anderson K, Ecke M, Muller-Taubenberger A, Schroth-Diez B, et al. (2009) The three-dimensional dynamics of actin waves, a model of cytoskeletal self-organization. Biophys J 96: 2888–2900. 10.1016/j.bpj.2008.12.3942 - DOI - PMC - PubMed
    1. Weiner OD, Marganski WA, Wu LF, Altschuler SJ, Kirschner MW (2007) An Actin-Based Wave Generator Organizes Cell Motility. PLoS Biol 5: e221 10.1371/journal.pbio.0050221 - DOI - PMC - PubMed
    1. Wu M, Wu X, Camilli PD (2013) Calcium oscillations-coupled conversion of actin travelling waves to standing oscillations. PNAS 110: 1339–1344. 10.1073/pnas.1221538110 - DOI - PMC - PubMed

Publication types

LinkOut - more resources