. 2015 Feb;125(2):665-80.
doi: 10.1172/JCI78253. Epub 2015 Jan 9.

UCP2-induced fatty acid synthase promotes NLRP3 inflammasome activation during sepsis

UCP2-induced fatty acid synthase promotes NLRP3 inflammasome activation during sepsis

Jong-Seok Moon et al. J Clin Invest. 2015 Feb.

Retraction in

Abstract

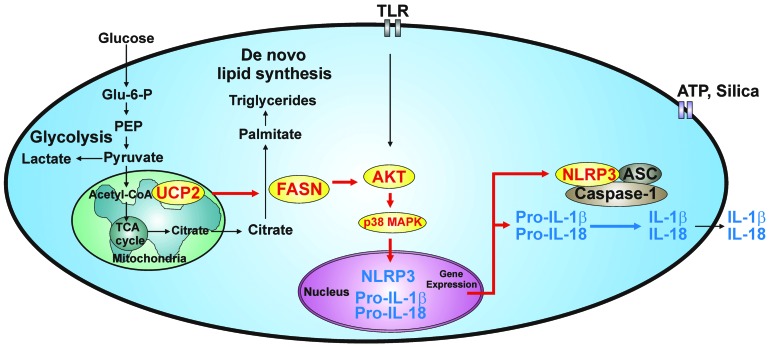
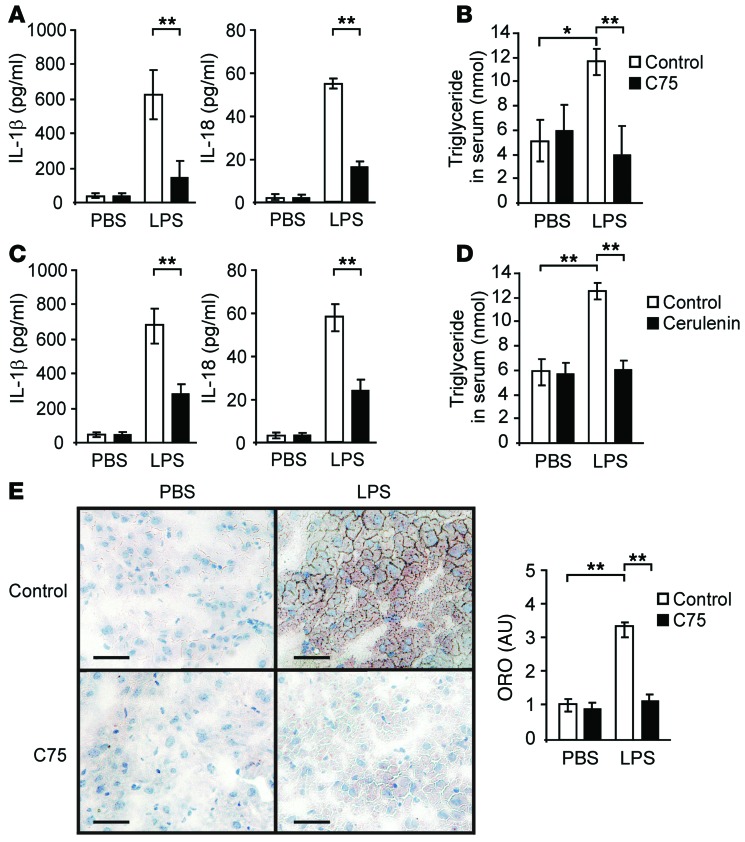
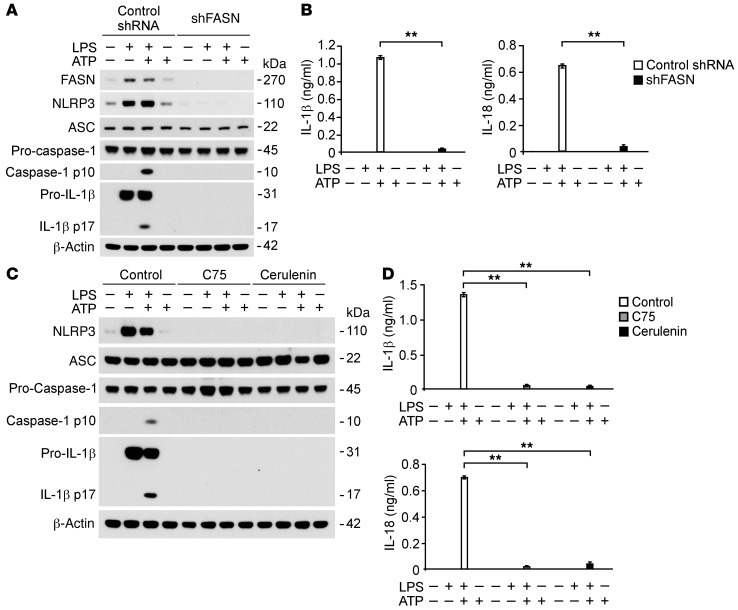
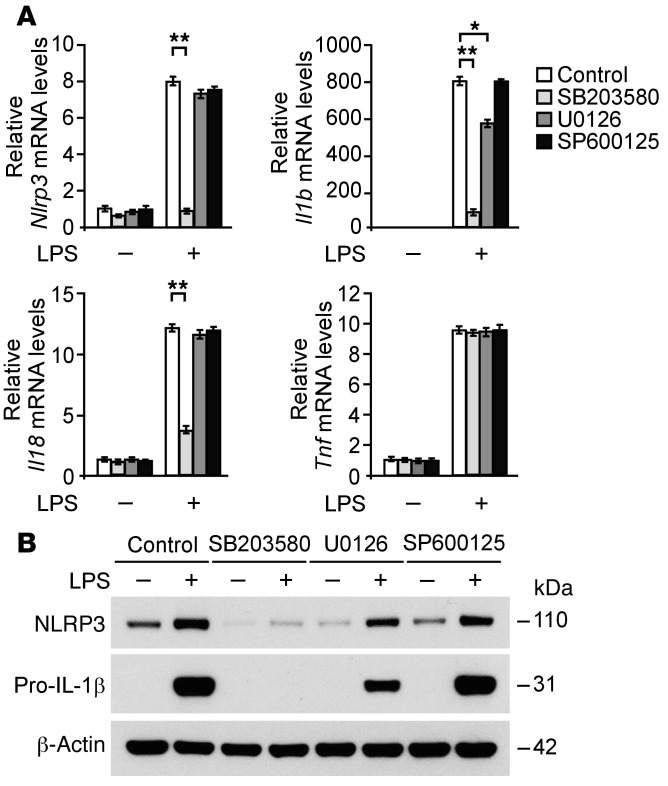
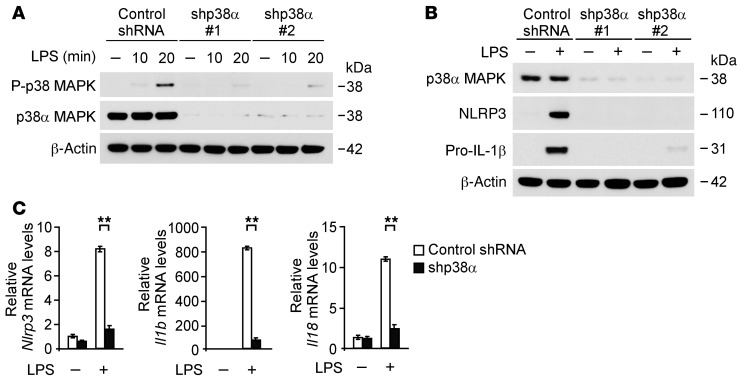
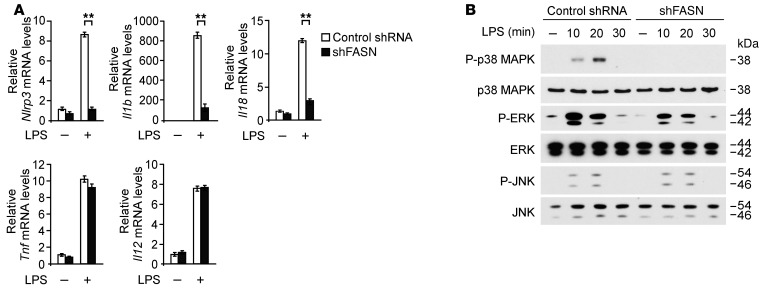
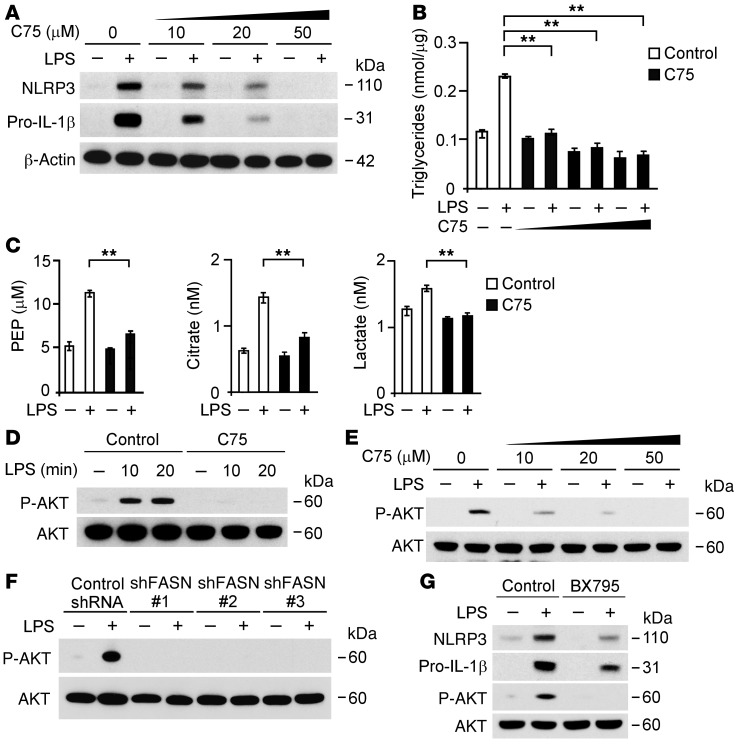
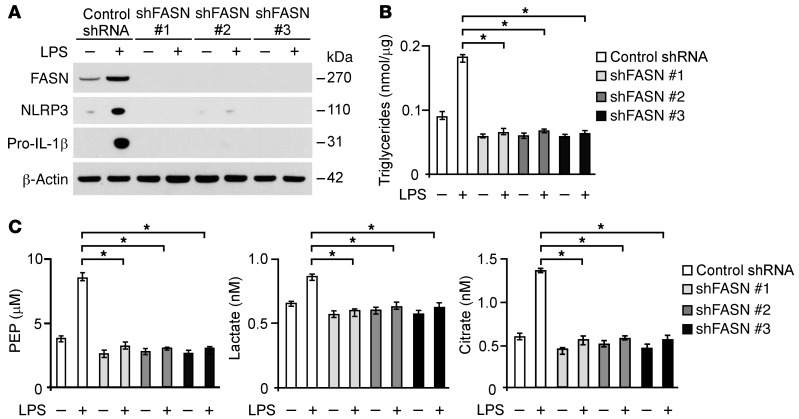
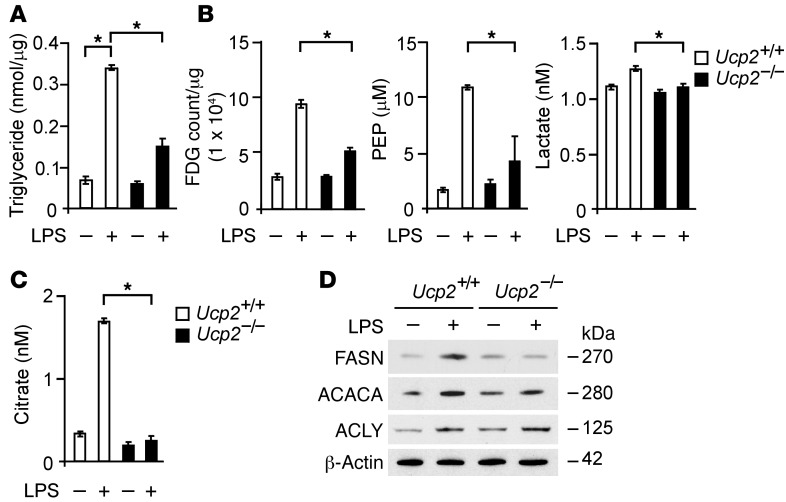
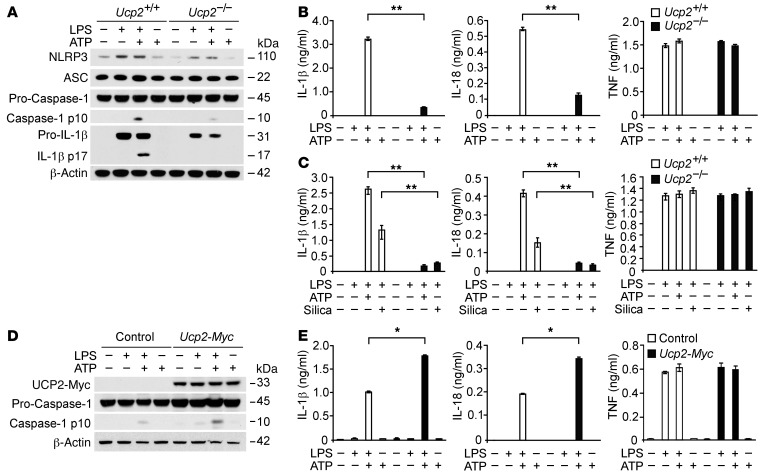
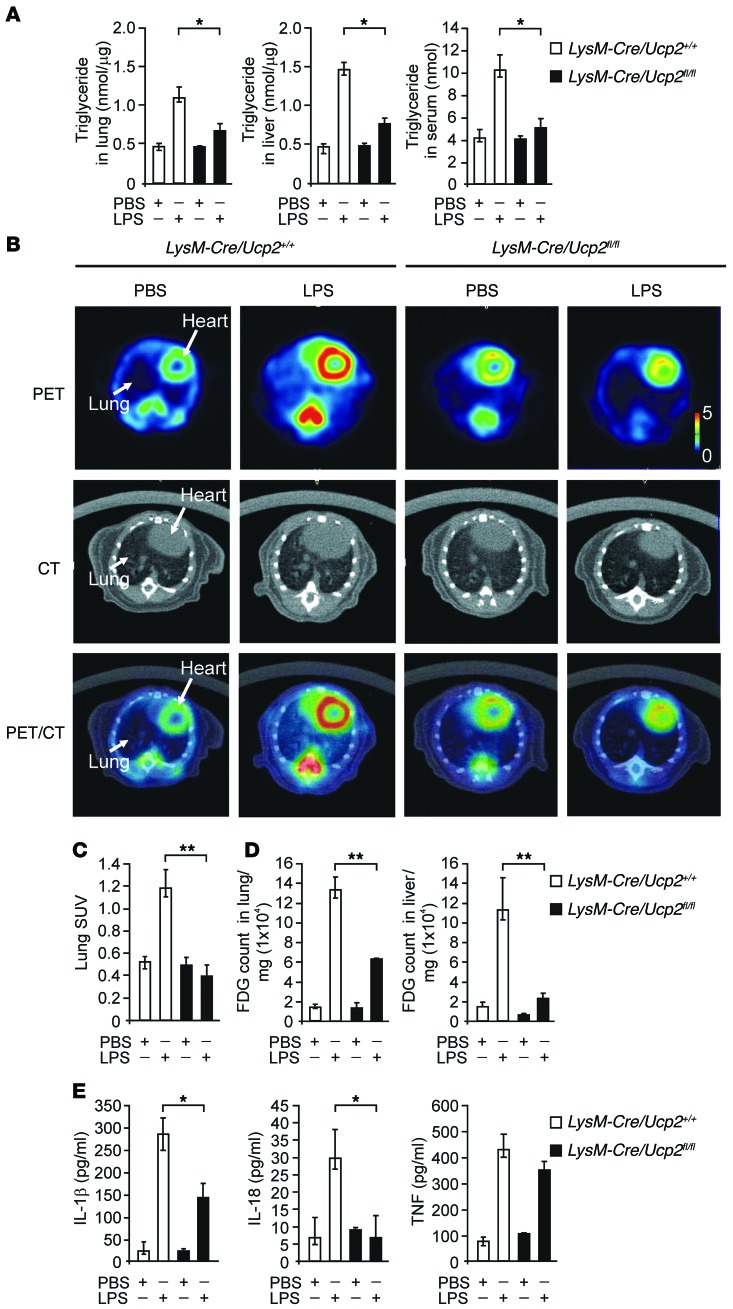
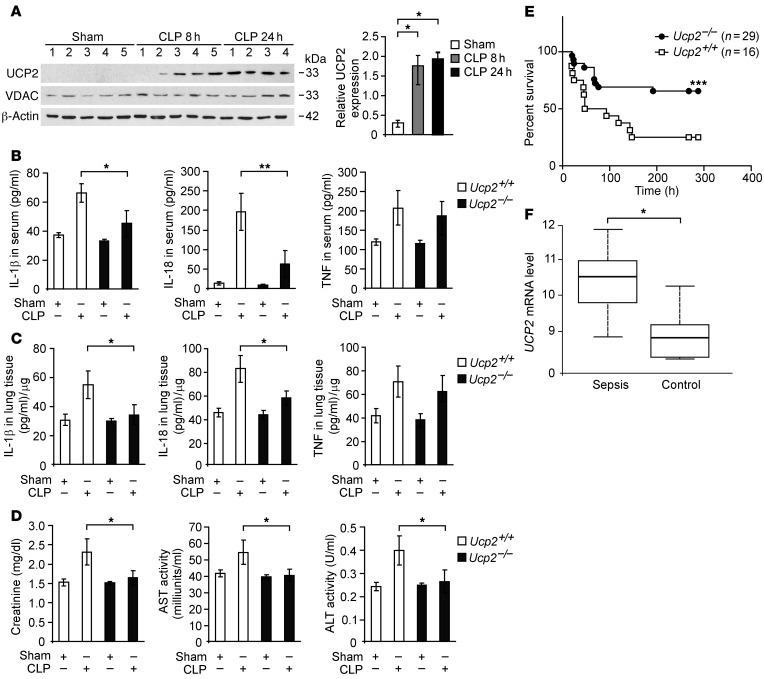
Cellular lipid metabolism has been linked to immune responses; however, the precise mechanisms by which de novo fatty acid synthesis can regulate inflammatory responses remain unclear. The NLRP3 inflammasome serves as a platform for caspase-1-dependent maturation and secretion of proinflammatory cytokines. Here, we demonstrated that the mitochondrial uncoupling protein-2 (UCP2) regulates NLRP3-mediated caspase-1 activation through the stimulation of lipid synthesis in macrophages. UCP2-deficient mice displayed improved survival in a mouse model of polymicrobial sepsis. Moreover, UCP2 expression was increased in human sepsis. Consistently, UCP2-deficient mice displayed impaired lipid synthesis and decreased production of IL-1β and IL-18 in response to LPS challenge. In macrophages, UCP2 deficiency suppressed NLRP3-mediated caspase-1 activation and NLRP3 expression associated with inhibition of lipid synthesis. In UCP2-deficient macrophages, inhibition of lipid synthesis resulted from the downregulation of fatty acid synthase (FASN), a key regulator of fatty acid synthesis. FASN inhibition by shRNA and treatment with the chemical inhibitors C75 and cerulenin suppressed NLRP3-mediated caspase-1 activation and inhibited NLRP3 and pro-IL-1β gene expression in macrophages. In conclusion, our results suggest that UCP2 regulates the NLRP3 inflammasome by inducing the lipid synthesis pathway in macrophages. These results identify UCP2 as a potential therapeutic target in inflammatory diseases such as sepsis.


Figures

Figure 12
Figure 12. Schematic of the proposed relationships between UCP2-FASN–regulated lipid synthesis and NLRP3-mediated caspase-1 activation.
Glu-6-P, glucose-6-phosphate; TCA, tricarboxylic acid.
Figure 11
Figure 11. Inhibition of FASN activity suppresses production of IL-1β and IL-18 in vivo.
(A) ELISA assay for IL-1β and IL-18 and (B) TG assay in the sera of wild-type mice after injection of C75 (10 mg/kg, i.p.) or DMSO for 16 hours, followed by LPS (10 mg/kg) or PBS for 8 hours. n = 3 per group, *P < 0.05, **P < 0.01, ANOVA. (C) ELISA assay for IL-1β and IL-18 and (D) TG assay in the sera of wild-type mice after injection of cerulenin (5 mg/kg, i.p.) or DMSO for 16 hours, followed by LPS (10 mg/kg) or PBS for 8 hours. n = 3 per group, **P < 0.01, ANOVA. (E) Mice were injected with C75 (10 mg/kg, i.p.) or DMSO. After 16 hours, mice were injected with LPS (10 mg/kg, i.p.) or PBS. Livers were harvested after an additional 8 hours. The image depicts Oil Red O (ORO) staining for neutral lipids and lipid droplet morphology in sections from frozen liver tissues. Scale bar: 100 μm; original magnification, ×40. n = 3 per group, **P < 0.01, ANOVA.
Figure 10
Figure 10. FASN regulates NLRP3-mediated caspase-1 activation in macrophages.
(A) Immunoblot analysis for caspase-1 and IL-1β of cell lysates from wild-type mouse peritoneal macrophages transduced with lentiviruses expressing nontarget shRNA or shRNA for FASN and stimulated with LPS (500 ng/ml) for 4 hours, followed by incubation with ATP (5 mM) for 30 minutes. β-Actin served as the standard. (B) ELISA assay for IL-1β and IL-18 in the media from A. **P < 0.01, ANOVA. (C) Immunoblot analysis for IL-1β and NLRP3 of cell lysates from wild-type mouse peritoneal macrophages pretreated with C75 (20 μM) and cerulenin (2 g/ml) for 2 hours before stimulation with LPS (500 ng/ml) for 4 hours, followed by incubation with ATP (5 mM) for 30 minutes. β-Actin served as the standard. (D) ELISA assay for IL-1β and IL-18 in the media from C. **P < 0.01, ANOVA.
Figure 9
Figure 9. Inhibition of p38 MAPK activation suppresses the transcription of Nlrp3 and Il1b genes in macrophages.
(A) Quantitative PCR analysis for Nlrp3, Il1b, Il18, and Tnf gene expression in cell lysates and (B) immunoblot analysis for expression of NLRP3 and IL-1β in cell lysates from wild-type BMDMs pretreated with SB203580 (10 μM), U0126 (10 μM), and SP600125 (10 μM) for 1 hour before stimulation with LPS (500 ng/ml) for 4 hours. *P < 0.05, **P < 0.01, ANOVA. β-Actin served as the standard.
Figure 8
Figure 8. p38 MAPK regulates NLRP3 and IL-1β expression in macrophages.
(A) Immunoblot analysis for activation of p38 MAPK in cell lysates from wild-type mouse peritoneal macrophages transduced with lentiviruses expressing nontarget shRNA or 2 independent shRNA for p38 (shp38 #1 and #2) and stimulated with LPS (500 ng/ml) for 0, 10, or 20 minutes. β-Actin served as the standard. (B) Immunoblot analysis for expression of NLRP3 and IL-1β in cell lysates from wild-type mouse peritoneal macrophages transduced with lentiviruses expressing control shRNA or 2 independent shRNA for p38 and stimulated with LPS (500 ng/ml) for 4 hours. β-Actin served as the standard. (C) Quantitative PCR analysis for Nlrp3, Il1b, and Il18 gene expression in wild-type mouse peritoneal macrophages transduced with lentiviruses expressing control shRNA or shRNA for p38 (shp38) and stimulated with LPS (500 ng/ml) for 4 hours. **P < 0.01, ANOVA.
Figure 7
Figure 7. Deficiency of FASN suppresses the transcription of Nlrp3 and Il1b genes through p38 MAPK in macrophages.
(A) Quantitative PCR analysis for Nlrp3, Il1b, Il18, Tnf, and Il12 gene expression in wild-type mouse peritoneal macrophages transduced with lentiviruses expressing nontarget shRNA or shRNA for FASN (shFASN) and stimulated with LPS (500 ng/ml) for 4 hours. **P < 0.01, ANOVA. (B) Immunoblot analysis for activation of p38 MAPK, ERK, and JNK in cell lysates from wild-type mouse peritoneal macrophages transduced with control shRNA or shRNA for FASN and stimulated with LPS (500 ng/ml) for 0, 10, 20, and 30 minutes.
Figure 6
Figure 6. FASN regulates NLRP3 and IL-1β expression through AKT activation in macrophages.
(A) Immunoblot analysis for NLRP3 and IL-1β and (B) measurement of TGs from wild-type BMDMs pretreated with C75 (0, 10, 20, and 50 μM) as well as (C) measurement of PEP, citrate, and lactate production from wild-type BMDMs pretreated with C75 (20 μM) for 2 hours before stimulation with LPS (500 ng/ml, 4 hours). β-Actin served as the standard. **P < 0.01, ANOVA. (D) Immunoblot analysis of AKT Ser473 phosphorylation in wild-type BMDMs pretreated with C75 (20 μM) for 2 hours before stimulation with LPS (500 ng/ml; 0, 10, and 20 minutes). Total AKT served as the standard. (E) Immunoblot analysis of AKT Ser473 phosphorylation in cell lysates from wild-type BMDMs pretreated with C75 (0, 10, 20, and 50 μM) for 2 hours before stimulation with LPS (500 ng/ml, 4 hours). Total AKT served as the standard. (F) Immunoblot analysis of AKT Ser473 phosphorylation in cell lysates from wild-type peritoneal macrophages transduced with lentiviruses expressing nontarget shRNA or 3 independent shRNA for FASN after stimulation with LPS (500 ng/ml, 4 hours). Total AKT served as the standard. (G) Immunoblot analysis for NLRP3, IL-1β, and AKT Ser473 phosphorylation in cell lysates from wild-type BMDMs pretreated with BX795 (10 μM) for 1 hour before stimulation with LPS (500 ng/ml, 4 hours). Total AKT served as the standard.
Figure 5
Figure 5. FASN regulates NLRP3 and IL-1β expression in macrophages.
(A) Immunoblot analysis for FASN, NLRP3, and IL-1β in cell lysates from wild-type mouse peritoneal macrophages transduced with lentiviruses expressing nontarget shRNA (Control shRNA) or 3 independent shRNA for FASN (shFASN #1, #2, and #3) and stimulated with LPS (500 ng/ml) for 4 hours. β-Actin served as the standard. (B) TG production and (C) PEP, citrate, and lactate production in wild-type mouse peritoneal macrophages transduced with lentiviruses expressing nontarget shRNA or 3 independent shRNA for FASN and stimulated with LPS (500 ng/ml) for 4 hours. *P < 0.05, ANOVA.
Figure 4
Figure 4. UCP2 regulates lipid synthesis via FASN in macrophages.
(A) TGs in Ucp2+/+ or Ucp2–/– BMDMs treated with LPS (500 ng/ml) for 4 hours. *P < 0.05, ANOVA. (B) 18F-FDG uptake and PEP and lactate production in Ucp2+/+ or Ucp2–/– BMDMs treated with LPS (500 ng/ml) for 4 hours. *P < 0.05, ANOVA. (C) Citrate production in Ucp2+/+ or Ucp2–/– BMDMs treated with LPS (500 ng/ml) for 4 hours. *P < 0.05, ANOVA. (D) Immunoblot analysis for FASN, ACACA, and ACLY in cell lysates from Ucp2+/+ or Ucp2–/– BMDMs treated with LPS (500 ng/ml) for 4 hours. β-Actin served as the standard.
Figure 3
Figure 3. UCP2 regulates NLRP3-mediated caspase-1 activation by NLRP3 and IL-1β induction in macrophages.
(A) Immunoblot analysis for caspase-1 and IL-1β of cell lysates from Ucp2+/+ or Ucp2–/– BMDMs treated with LPS (500 ng/ml) for 4 hours, followed by incubation with ATP (2 mM) for 30 minutes. β-Actin served as the standard. (B) Luminex assay and ELISA assay for IL-1β, IL-18, and TNF secretion in the media from A. **P < 0.01, ANOVA. (C) ELISA assay for IL-1β, IL-18, and TNF secretion in the supernatants from Ucp2+/+ or Ucp2–/– BMDMs treated with LPS (500 ng/ml) for 4 hours, followed by incubation with ATP (2 mM) for 30 minutes or silica (200 mg/ml) for 10 hours. **P < 0.01, ANOVA. (D) Immunoblot analysis for Myc-tagged UCP2 and caspase-1 of cell lysates from mouse J774A.1 macrophages transfected with control vector or Myc-tagged UCP2 expression vector, treated with LPS (500 ng/ml) for 4 hours, followed by followed by incubation with ATP (5 mM) for 30 minutes. β-Actin served as the standard. (E) ELISA assay for IL-1β, IL-18, and TNF secretion in the supernatants from mouse J774A.1 macrophages transfected with control vector or Myc-tagged UCP2 expression vector, treated with LPS (500 ng/ml) for 4 hours, followed by incubation with ATP (5 mM) for 30 minutes. *P < 0.05, ANOVA.
Figure 2
Figure 2. Deficiency of UCP2 inhibits lipid production through glucose uptake in vivo.
(A) TG production in the lungs, livers, and sera from LysM-Cre/Ucp2+/+ or LysM-Cre/Ucp2fl/fl mice after injection of LPS for 4 hours (10 mg/kg, i.p.). n = 3 per group, *P < 0.05, ANOVA. (B) Transverse SUV of PET/CT imaging using 18F-FDG of lungs from LysM-Cre/Ucp2+/+ or LysM-Cre/Ucp2fl/fl mice after injection of LPS for 4 hours (10 mg/kg, i.p.). Representative image of 3 independent experiments. Original magnification, ×2. (C) Quantification of transverse SUV in PET/CT imaging from B. n = 3 per group, **P < 0.01, ANOVA. (D) Ex vivo γ-ray counting using 18F-FDG of lungs and livers from LysM-Cre/Ucp2+/+ or LysM-Cre/Ucp2fl/fl mice after injection of LPS (10 mg/kg, i.p.) for 4 hours. n = 3 per group, **P < 0.01 ANOVA. (E) Luminex assay and ELISA assay for IL-1β, IL-18, and TNF secretion in the serum from B and D. n = 6 per group, *P < 0.05, ANOVA.
Figure 1
Figure 1. Deficiency of UCP2 protects against CLP-induced mortality in vivo.
(A) Immunoblot analysis of UCP2 and voltage-dependent anion channel (VDAC) in lung tissues from wild-type mice 8 and 24 hours after CLP or sham laparotomy. β-Actin served as the standard. *P < 0.05, ANOVA. (B) ELISA assay for IL-1β, IL-18, and TNF in the sera and (C) in the lung tissues from Ucp2+/+ or Ucp2–/– mice 24 hours after CLP or sham laparotomy. For both Ucp2+/+ and Ucp2–/– mice, sham, n = 2, and CLP, n = 8. *P < 0.05, **P < 0.01, ANOVA. (D) Organ dysfunction of CLP was determined in Ucp2+/+ or Ucp2–/– mice 24 hours after CLP or sham laparotomy. Organ dysfunction biomarkers, including creatinine, aspartate aminotransferase (AST), and alanine aminotransferase (ALT), were measured in sera. For both Ucp2+/+ and Ucp2–/– mice, sham, n = 2, and CLP, n = 8. *P < 0.05, ANOVA. (E) Survival curve of CLP was determined in Ucp2+/+ or Ucp2–/– mice. Ucp2+/+, n = 16; Ucp2–/–, n = 29. ***P < 0.0055, log-rank test. (F) Box plots comparing measures of UCP2 mRNA levels in whole-blood samples of sepsis (n = 30) and control (n = 19) patients. The UCP2 mRNA levels are presented as median value (black line), interquartile range (box), and minimum and maximum of all data (whiskers). *P < 0.05, ANOVA.

References

    1. Angus DC, van der Poll T. Severe sepsis and septic shock. N Engl J Med. 2013;369(9):840–851. doi: 10.1056/NEJMra1208623. - DOI - PubMed
    1. Hotchkiss RS, Karl IE. The pathology and treatment of sepsis. N Engl J Med. 2003;348(2):138–150. doi: 10.1056/NEJMra021333. - DOI - PubMed
    1. Rogers AJ, et al. Metabolomic derangements are associated with mortality in critically ill adult patients. PLoS One. 2014;9(1):e87538. doi: 10.1371/journal.pone.0087538. - DOI - PMC - PubMed
    1. Langley RJ, et al. An integrated clinico-metabolomic model improves prediction of death in sepsis. Sci Transl Med. 2013;5(195):195ra95. - PMC - PubMed
    1. Dolinay T, et al. Inflammasome-regulated cyto­kines are critical mediators of acute lung injury. Am J Respir Crit Care Med. 2012;185(11):1225–1234. doi: 10.1164/rccm.201201-0003OC. - DOI - PMC - PubMed

Publication types

MeSH terms