. 2015 Feb;143(2):482-98.
doi: 10.1093/toxsci/kfu249. Epub 2015 Jan 8.

Elevated adult neurogenesis in brain subventricular zone following in vivo manganese exposure: roles of copper and DMT1

Affiliations

Elevated adult neurogenesis in brain subventricular zone following in vivo manganese exposure: roles of copper and DMT1

Sherleen Fu et al. Toxicol Sci. 2015 Feb.

Abstract

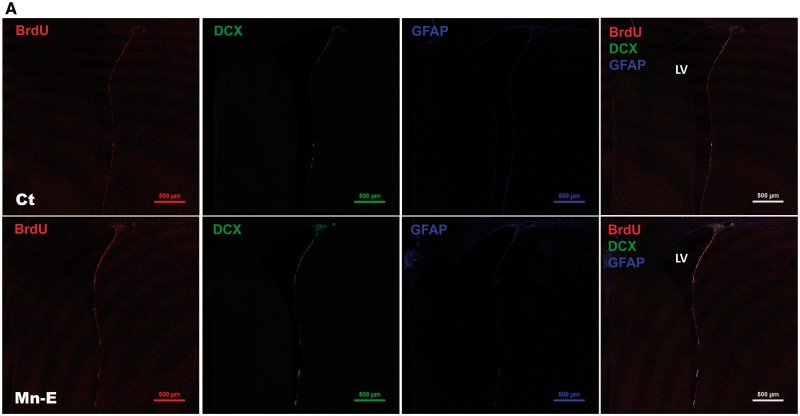
The brain subventricular zone (SVZ) is a source of neural precursor cells; these cells travel along the rostral migratory stream (RMS) to destination areas in the process of adult neurogenesis. Recent x-ray fluorescence (XRF) studies reveal an extensive accumulation of copper (Cu) in the SVZ. Earlier human and animal studies also suggest an altered Cu homeostasis after manganese (Mn) exposure. This study was designed to test the hypothesis that Mn exposure by acting on the divalent metal transporter-1 (DMT1) altered Cu levels in SVZ and RMS, thereby affecting adult neurogenesis. Adult rats received intraperitoneal (i.p.) injections of 6 mg Mn/kg as MnCl2 once daily for 4 weeks with concomitant injections of bromodeoxyuridine (BrdU) for 5 days in the last week. In control rats, Cu levels were significantly higher in the SVZ than other brain regions examined. Mn exposure significantly reduced Cu concentrations in the SVZ (P < 0.01). Immunohistochemical data showed that in vivo Mn exposure significantly increased numbers of BrdU(+) cells, which were accompanied with increased GFAP(+) astrocytic stem cells and DCX(+) neuroblasts in SVZ and RMS. Quantitative RT-PCR and Western blot confirmed the increased expression of DMT1 in SVZ following in vivo Mn exposure, which contributed to Mn accumulation in the neurogenesis pathway. Taken together, these results indicate a clear disruptive effect of Mn on adult neurogenesis; the effect appears due partly to Mn induction of DMT1 and its interference with cellular Cu regulation in SVZ and RMS. The future research directions based on these observations are also discussed.

Keywords: adult neurogenesis; copper; divalent metal transporter-1; manganese; rostral migratory stream; subventricular zone.


Figures

FIG. 1.
FIG. 1.
IHC double-staining of BrdU and DMT1 in the SVZ by coronal sections. Rats received i.p. injection of 6 mg Mn/kg once daily, 5 days per week, for 4 weeks. BrdU was injected in the last 5 days. A, Typical coronal images at low magnification (×40) from control and Mn-exposed animals stained for BrdU (red) and DMT1 (green). Images were taken sequentially using the same imaging parameters. B, Typical coronal images at high magnifications (×100 or × 600). The symbols of white square and circle represent the approximate regions used to “zoom-in” the confocal images with ×600 in magnification. Additional confocal data on coronal sections from the same experiments (n = 3) are presented in Supplementary Figure 1. C, Quantification of the intensity of fluorescent signals by DMT and BrdU. Data represent mean ± SD, n = 3; **P < 0.01, when compared with the control. Ct, control group; Mn-E, Mn-exposed group.
FIG. 2.
FIG. 2.
IHC double-staining of BrdU and DMT1 in SVZ and RMS by sagittal sections. A, Typical sagittal images at low magnification (×40) from control and Mn-exposed animals stained for BrdU (red) and DMT1 (green). B, Typical sagittal images with high magnifications (×100 or × 600). The symbols of white square/circle and white star represent the regions approximating SVZ and RMS, respectively, which were used to “zoom-in” the confocal images with ×600 in magnification. Confocal data on sagittal sections from additional animals in the same experiments (n = 3) are presented in Supplementary Figure 2. C, Fluorescent intensity quantification data of DMT1 and BrdU. Data represent mean ± SD, n = 3; *P < 0.05, **P < 0.01, when compared with the control. Ct, control group; Mn-E, Mn-exposed group.
FIG. 3.
FIG. 3.
IHC triple-staining of BrdU, GFAP, and DCX in the SVZ by coronal sections. A, Typical coronal images at low magnification (×40) from control and Mn-exposed animals (n = 3) stained for BrdU (red), DCX (green), and GFAP (blue). Images were taken sequentially using the same imaging parameters. B1, Typical images of control coronal section at high magnification (×200). The symbols of white square and circle represent the approximate regions used to “zoom-in” the confocal images. B2, Typical images of Mn-exposed coronal section at high magnification (×200). The symbols of white square and circle represent the approximate regions used to “zoom-in” the confocal images. C1, Control “zoom-in” images of the region labeled with the white square in Figure 3B1. White arrows point at the BrdU-labeled nuclei that are not surrounded by green DCX fluorescent signals. C2, Mn-exposed “zoom-in” images of the region labeled with the white square in Figure 3B2. White arrows point at the BrdU-labeled nuclei that are not surrounded by green DCX fluorescent signals. D1, Control “zoom-in” images of the region labeled with the white circle in Figure 3B1. D2, Mn-exposed “zoom-in” images of the region labeled with the white circle in Figure 3B2. White arrows point at the BrdU-labeled nuclei that are not surrounded by green DCX fluorescent signals. Ct, control group; Mn-E, Mn-exposed group.
FIG. 3.
FIG. 3.
IHC triple-staining of BrdU, GFAP, and DCX in the SVZ by coronal sections. A, Typical coronal images at low magnification (×40) from control and Mn-exposed animals (n = 3) stained for BrdU (red), DCX (green), and GFAP (blue). Images were taken sequentially using the same imaging parameters. B1, Typical images of control coronal section at high magnification (×200). The symbols of white square and circle represent the approximate regions used to “zoom-in” the confocal images. B2, Typical images of Mn-exposed coronal section at high magnification (×200). The symbols of white square and circle represent the approximate regions used to “zoom-in” the confocal images. C1, Control “zoom-in” images of the region labeled with the white square in Figure 3B1. White arrows point at the BrdU-labeled nuclei that are not surrounded by green DCX fluorescent signals. C2, Mn-exposed “zoom-in” images of the region labeled with the white square in Figure 3B2. White arrows point at the BrdU-labeled nuclei that are not surrounded by green DCX fluorescent signals. D1, Control “zoom-in” images of the region labeled with the white circle in Figure 3B1. D2, Mn-exposed “zoom-in” images of the region labeled with the white circle in Figure 3B2. White arrows point at the BrdU-labeled nuclei that are not surrounded by green DCX fluorescent signals. Ct, control group; Mn-E, Mn-exposed group.
FIG. 4.
FIG. 4.
IHC triple-staining of BrdU, GFAP, and DCX in the SVZ by sagittal sections. A, Typical sagittal images at low magnification (×40) from control and Mn-exposed animals (n = 3) stained for BrdU (red), DCX (green), and GFAP (blue). Images were taken sequentially using the same imaging parameters. B, Typical sagittal images at ×100 magnification from control and Mn-exposed animals stained for BrdU (red), DCX (green), and GFAP (blue). The symbols of white square, circle, and star represent the approximate regions used to “zoom-in” the confocal images. C1, Control “zoom-in” images of the region labeled with the white square in Figure 4B (Ct). White arrows point at the BrdU-labeled nuclei that are not surrounded by green DCX fluorescent signals. C2, Mn-exposed “zoom-in” images of the region labeled with the white square in Figure 4B (Mn-E). White arrows point at the BrdU-labeled nuclei that are not surrounded by green DCX fluorescent signals. D1, Control “zoom-in” images of the region labeled with the white circle in Figure 4B (Ct). White arrows point at the BrdU-labeled nuclei that are not surrounded by green DCX fluorescent signals. D2, Mn-exposed “zoom-in” images of the region labeled with the white circle in Figure 4B (Mn-E). The white arrows point at the BrdU-labeled nuclei that are not surrounded by green DCX fluorescent signals. E1, Control “zoom-in” images of the region labeled with the white star in Figure 4B (Ct). White arrows point at the BrdU-labeled nuclei that are not surrounded by green DCX fluorescent signals. E2, Mn-exposed “zoom-in” images of the region labeled with the white star in Figure 4B (Mn-E). The white arrows point at the BrdU-labeled nuclei that are not surrounded by green DCX fluorescent signals. Ct, control group; Mn-E, Mn-exposed group.
FIG. 4.
FIG. 4.
IHC triple-staining of BrdU, GFAP, and DCX in the SVZ by sagittal sections. A, Typical sagittal images at low magnification (×40) from control and Mn-exposed animals (n = 3) stained for BrdU (red), DCX (green), and GFAP (blue). Images were taken sequentially using the same imaging parameters. B, Typical sagittal images at ×100 magnification from control and Mn-exposed animals stained for BrdU (red), DCX (green), and GFAP (blue). The symbols of white square, circle, and star represent the approximate regions used to “zoom-in” the confocal images. C1, Control “zoom-in” images of the region labeled with the white square in Figure 4B (Ct). White arrows point at the BrdU-labeled nuclei that are not surrounded by green DCX fluorescent signals. C2, Mn-exposed “zoom-in” images of the region labeled with the white square in Figure 4B (Mn-E). White arrows point at the BrdU-labeled nuclei that are not surrounded by green DCX fluorescent signals. D1, Control “zoom-in” images of the region labeled with the white circle in Figure 4B (Ct). White arrows point at the BrdU-labeled nuclei that are not surrounded by green DCX fluorescent signals. D2, Mn-exposed “zoom-in” images of the region labeled with the white circle in Figure 4B (Mn-E). The white arrows point at the BrdU-labeled nuclei that are not surrounded by green DCX fluorescent signals. E1, Control “zoom-in” images of the region labeled with the white star in Figure 4B (Ct). White arrows point at the BrdU-labeled nuclei that are not surrounded by green DCX fluorescent signals. E2, Mn-exposed “zoom-in” images of the region labeled with the white star in Figure 4B (Mn-E). The white arrows point at the BrdU-labeled nuclei that are not surrounded by green DCX fluorescent signals. Ct, control group; Mn-E, Mn-exposed group.
FIG. 5.
FIG. 5.
mRNA and protein expression of DMT1 in control and Mn-exposed SVZ tissues. A, mRNA expression level of Dmt1 in control and Mn-exposed SVZ tissues was quantified by qPCR and expressed as the relative expression ratio by normalizing with the Actb. The data are representative of triplicate experiments. Data represent mean ± SD, n = 4–5; *P < 0.05, when compared with controls. B, Typical Western blot autographs of DMT1 in SVZ tissues from 3 control and 3 Mn-exposed animals. C, Quantification of Western blot densitometry and statistical analysis. Ct, control group; Mn-E, Mn-exposed group. Data represent mean ± SD, n = 3; **P < 0.01, when compared with controls.
FIG. 6.
FIG. 6.
Gfap, Nestin, and Dcx mRNA expression in control and Mn-exposed SVZ tissues. A, mRNA expression levels of Gfap in control and Mn-exposed SVZ tissues were measured using qPCR and expressed as the relative expression ratio by normalizing with the Actb. B, mRNA expression levels of Nestin in control and Mn-exposed SVZ tissues were quantified by qPCR and expressed as the relative expression ratio by normalizing with the Actb. C, mRNA expression levels of Dcx in control and Mn-exposed SVZ tissues were quantified by qPCR and expressed as the relative expression ratio by normalizing with the Actb. The data are representative of triplicate experiments. Data represent mean ± SD, n = 5–6; *P < 0.05, when compared with controls. Ct, control group; Mn-E, Mn-exposed group.

Comment in

References

    1. Andrews N. C. (1999). The iron transporter DMT1. Int. J. Biochem. Cell Biol. 31, 991–994. - PubMed
    1. Barnham K. J., Bush A. I. (2008). Metals in Alzheimer’s and Parkinson’s diseases. Curr. Opin. Chem. Biol. 12, 222–228. - PubMed
    1. Burdo J. R., Menzies S. L., Simpson I. A., Garrick L. M., Garrick M. D., Dolan K. G., Haile D. J., Beard J. L., Connor J. R. (2001). Distribution of divalent metal transporter 1 and metal transport protein 1 in the normal and Belgrade rat. J. Neurosci. 66, 1198–1207. - PubMed
    1. Choi B. S., Zheng W. (2009). Copper transport to the brain by the blood-brain barrier and blood-CSF barrier. Brain Res. 1248, 14–21. - PMC - PubMed
    1. Curtis M. A., Faull R. L. M., Eriksson P. S. (2007). The effect of neurodegenerative diseases on the subventricular zone. Nat. Rev. Neurosci. 8, 712–723. - PubMed

Publication types

MeSH terms