

Can the site-frequency spectrum distinguish exponential population growth from multiple-merger coalescents?
- PMID: 25575536
- PMCID: PMC4349076
- DOI: 10.1534/genetics.114.173807
Can the site-frequency spectrum distinguish exponential population growth from multiple-merger coalescents?
Abstract
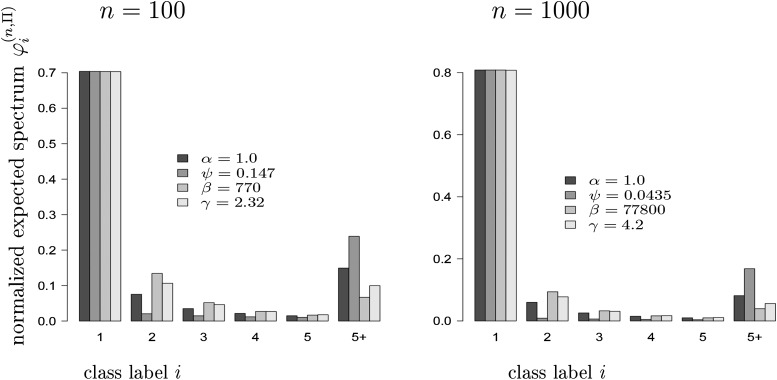
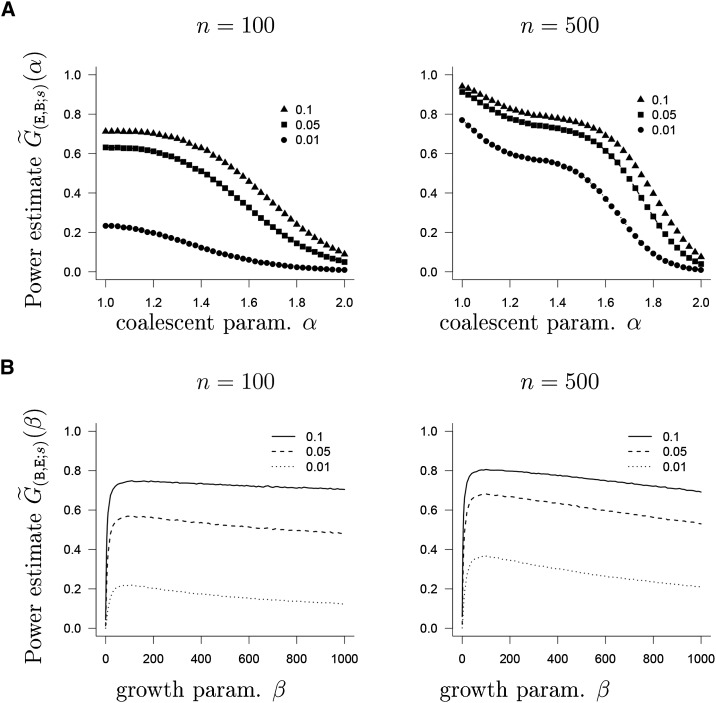
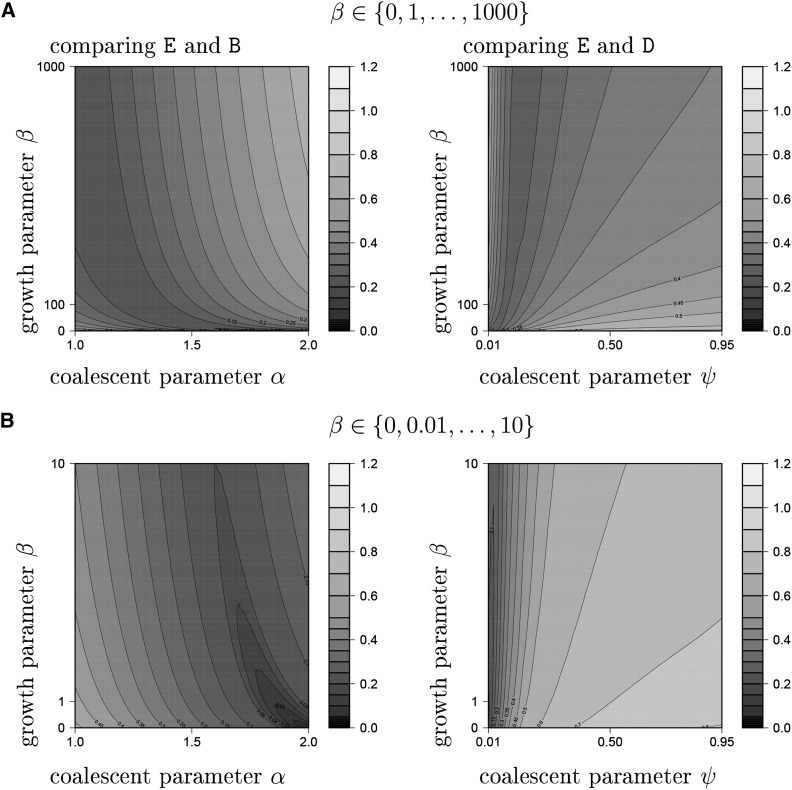
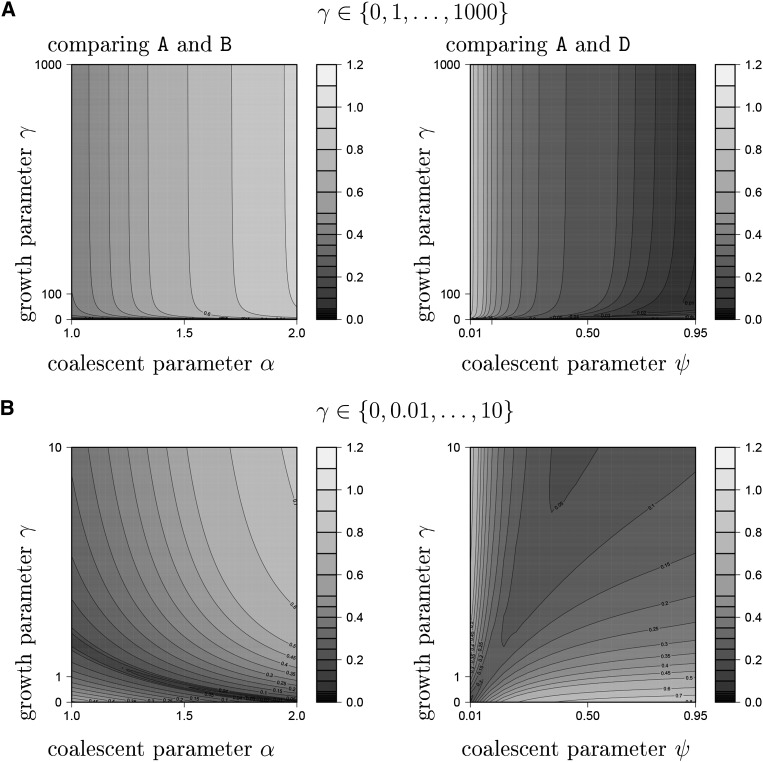
The ability of the site-frequency spectrum (SFS) to reflect the particularities of gene genealogies exhibiting multiple mergers of ancestral lines as opposed to those obtained in the presence of population growth is our focus. An excess of singletons is a well-known characteristic of both population growth and multiple mergers. Other aspects of the SFS, in particular, the weight of the right tail, are, however, affected in specific ways by the two model classes. Using an approximate likelihood method and minimum-distance statistics, our estimates of statistical power indicate that exponential and algebraic growth can indeed be distinguished from multiple-merger coalescents, even for moderate sample sizes, if the number of segregating sites is high enough. A normalized version of the SFS (nSFS) is also used as a summary statistic in an approximate Bayesian computation (ABC) approach. The results give further positive evidence as to the general eligibility of the SFS to distinguish between the different histories.
Keywords: approximate Bayesian computation; approximate maximum likelihood test; coalescent; multiple mergers; population growth; site-frequency spectrum.
Copyright © 2015 by the Genetics Society of America.
Figures
References
-
- Baragatti M., Pudlo P., 2014. An overview on approximate Bayesian computation. ESAIM Proc. 44: 291–299.
-
- Beaumont M. A., 2010. Approximate Bayesian computation in evolution and ecology. Annu. Rev. Ecol. Evol. Syst. 41: 379–406.
-
- Beckenbach A. T., 1994. Mitochondrial haplotype frequencies in oysters: neutral alternatives to selection models, pp. 188–198 in Non-Neutral Evolution, edited by Golding B. Chapman & Hall, New York.
Publication types
MeSH terms
LinkOut - more resources
Full Text Sources
Other Literature Sources
