. 2015 Apr 15:572:19-27.
doi: 10.1016/j.abb.2014.12.024. Epub 2015 Jan 6.

Cellular localization of β-carotene 15,15' oxygenase-1 (BCO1) and β-carotene 9',10' oxygenase-2 (BCO2) in rat liver and intestine

Affiliations

Cellular localization of β-carotene 15,15' oxygenase-1 (BCO1) and β-carotene 9',10' oxygenase-2 (BCO2) in rat liver and intestine

Shiva Raghuvanshi et al. Arch Biochem Biophys. .

Abstract

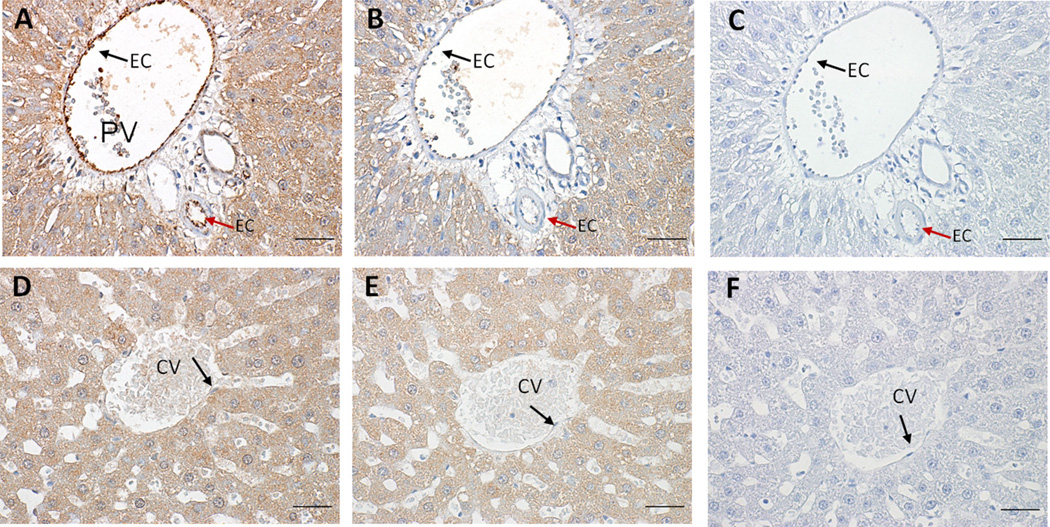
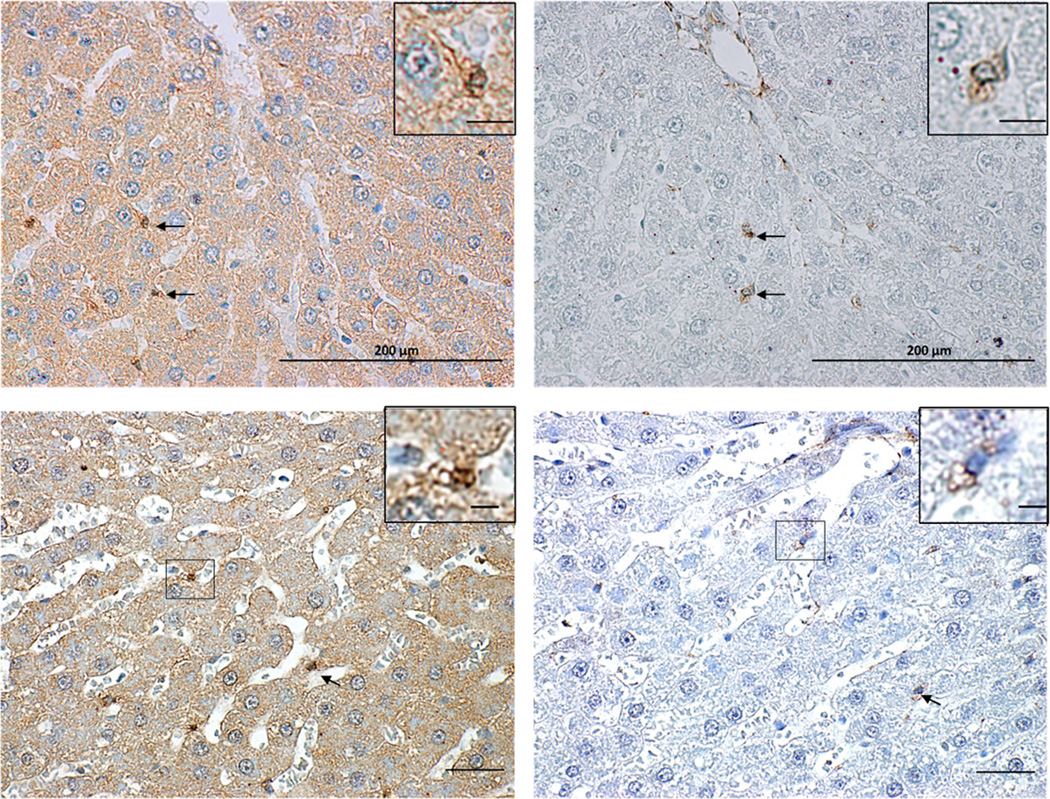
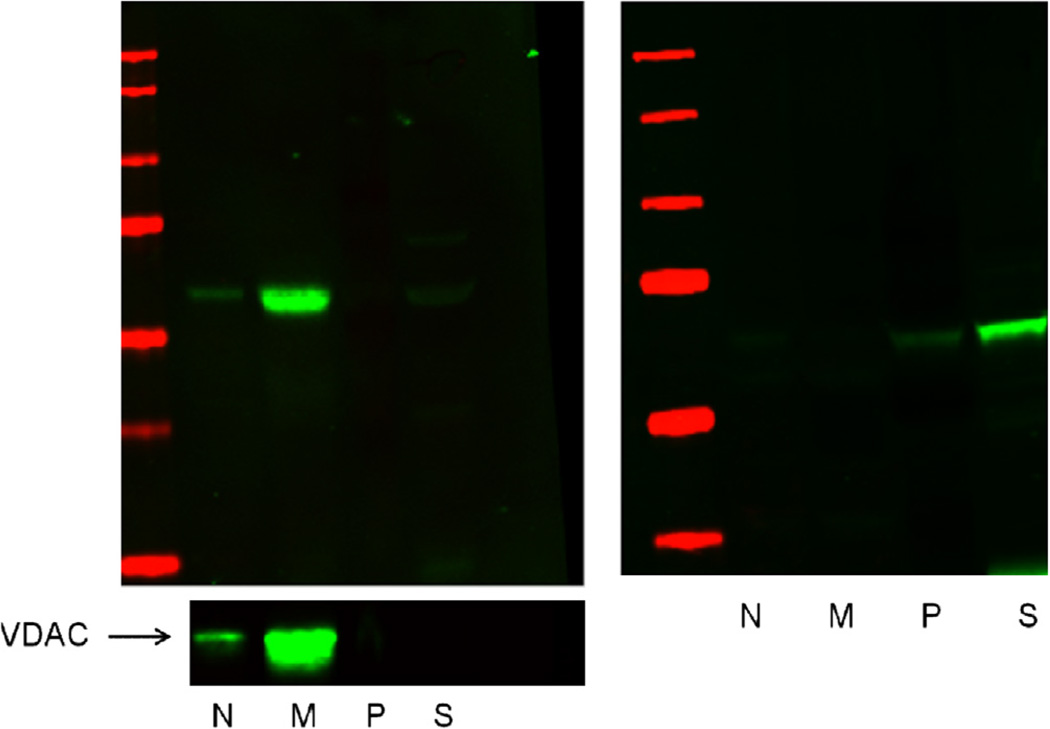
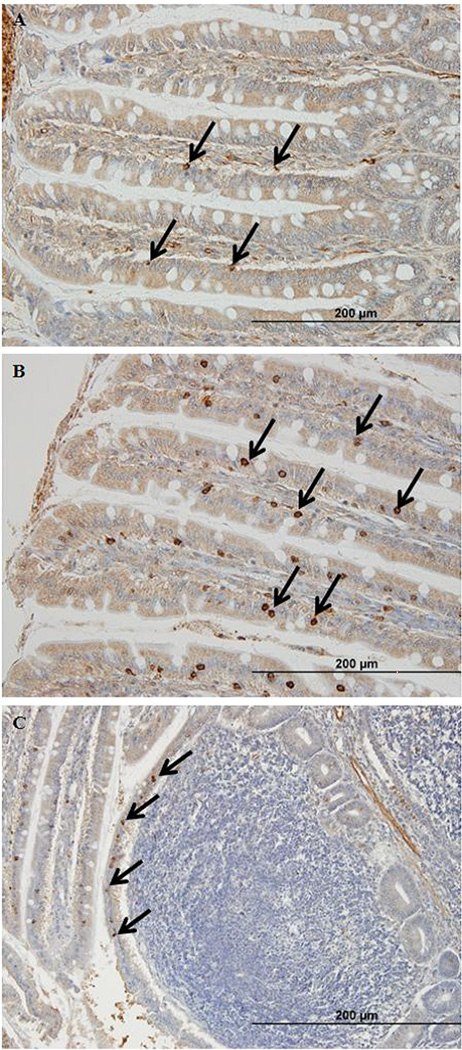
The intestine and liver are crucial organs for vitamin A uptake and storage. Liver accounts for 70% of total body retinoid stores. Vitamin A deficiency (VAD) is a major micronutrient deficiency around the world. The provitamin A carotenoid, β-carotene, is a significant source of vitamin A in the diet. β-Carotene 15,15' oxygenase-1 (BCO1) and β-carotene 9',10' oxygenase-2 (BCO2) are the two known carotenoid cleavage enzymes in humans. BCO1 and BCO2 are highly expressed in liver and intestine. Hepatocytes and hepatic stellate cells are two main cell types involved in the hepatic metabolism of retinoids. Stellate-like cells in the intestine also show ability to store vitamin A. Liver is also known to accumulate carotenoids, however, their uptake, retention and metabolism in specific liver and intestinal cell types is still unknown. Hence, we studied the cellular and subcellular expression and localization of BCO1 and BCO2 proteins in rat liver and intestine. We demonstrate that both BCO1 and BCO2 proteins are localized in hepatocytes and mucosal epithelium. We also show that BCO1 is also highly expressed in hepatic stellate cells (HSC) and portal endothelial cells in liver. At the subcellular level in liver, BCO1 is found in cytosol, while BCO2 is found in mitochondria. In intestine, immunohistochemistry showed strong BCO1 immunoreactivity in the duodenum, particularly in Brunner's glands. Both BCO1 and BCO2 showed diffuse presence along epithelia with strong immunoreactivity in endothelial cells and in certain epithelial cells which warrant further investigation as possible intestinal retinoid storage cells.

Keywords: Hepatic stellate cells; Immunohistochemistry; Vitamin A; β-Carotene; β-Carotene 15,15′-oxygenase (BCO1); β-Carotene 9′,10′ oxygenase (BCO2).


Figures

Fig. 1
Fig. 1
Immunoblots showing specificity of BCO1 and BCO2 antibodies. The specificity of antibody to BCO1 (1:5000) was verified by immunofluorescence. Cell nuclei are stained blue with DAPI. ATCC CHO cells are negative for (A) BCO1 and (B) BCO2. (C) BCO2 (1:5000) antibody shows no immunoreactivity in BCO1 cDNA transfected cell line (NY CHO). (D) NY CHO cells stably transfected with BCO1 show positive immunoreactivity (Alexa 488) with BCO1 antibody. Images obtained with the Olympus FV1000 confocal microscope. Specificity of antibodies was also verified with Western blot (gel on right). BCO1 shows immunoreactivity at ~63 kDa in BCO1 cDNA transfected cell line (BCO1) and whole liver homogenate (LIVER) as a red band, but no reactivity in ATCC-CHO cells. BCO2 show immunoreactivity at ~60 kDa in whole liver homogenate as a green band, but no reactivity with ATCC-CHO or BCO1-CHO cells. Molecular weight markers shown at left. Total protein per well was 40 µg.
Fig. 2
Fig. 2
Comparison of BCO1 and BCO2 protein expression in serial sections of rat liver tissue. Specific staining shown in brown. (A) Localization of BCO1 (1:250) in endothelial cells lining portal vein (black arrow, EC) and hepatic artery (red arrow, EC). (B) BCO2 (1:250) protein expressed in peri-portal hepatocytes. Portal endothelial cells (EC) lack BCO2 expression. Endothelial cells of central vein is negative for BCO1 and BCO2 (arrows, panel D–E). Panel C and F are negative controls for BCO1 and BCO2. PV, portal vein EC, endothelial cells, CV, central vein, scale bar = 35 µm.
Fig. 3
Fig. 3
Expression and localization of BCO1 in endothelial cells. (A) Arrows indicate the endothelial cells of HA and PV that are positively stained for BCO1 (1:250). Note that endothelial cells lining bile duct are negative for BCO1. (B) Higher magnification of portal vein endothelial cells shows BCO1 staining. PV, portal vein; BD, bile duct; HA, hepatic artery. Scale bar 40 µm.
Fig. 4
Fig. 4
Comparison of BCO1 and BCO2 protein expression in parenchyma. Panel A and C shows localization of BCO1 (1:250) protein in parenchyma. Hepatic stellate cells shows BCO1 expression in parenchyma (A and C, arrows). Panel B and D shows BCO2 expression in parenchyma. Scale bar = 35 µm.
Fig. 5
Fig. 5
Expression of BCO1 protein in hepatic stellate cells. BCO1 (1:250) uniformly expressed in hepatocytes (brown presence with blue nucleus). Hepatic stellate cells (HSC) with lipid droplets, shown at higher magnification (in insets), also shows strong reactivity for BCO1 antibody. Scale bar 35 µm, 7 µm (inset).
Fig. 6
Fig. 6
Expression of BCO1 and desmin (stellate cell marker) in serial sections of rat liver. Arrows shows HSC immunostained with BCO1 (1:250) antibody (left panels) co-localize with the HSC stained for desmin (1:50; DES, right panels). Insets denote the HSC immunostained for BCO1 and desmin at higher magnification. Scale bar 35 µm, insets, 7 µm.
Fig. 7
Fig. 7
Immunoblots showing sub-cellular expression of BCO1 (1:5000), BCO2 (1:5000) and VDAC1 (1:2000) proteins in rat liver cell fractions including nuclear (N), mitochondrial (M), microsomal (P) and cytosolic (S). Left panels show the expression of BCO2 (full gel) and VDAC1 (lower gel) in liver cell fractions. Right panel shows the expression of BCO1 in the same fractions. Equal quantities of total protein were loaded on each lane.
Fig. 8
Fig. 8
Co-localization of BCO2 and mitotracker. Double immunofluorescence staining shows for BCO2 (1:2000) (green) and 400 nM mitotracker (red) in McA cells. Right panel shows merged image for mitotracker dye and endogenously expressed BCO2 protein in McA cells. Yellow color shows colocalization of BCO2 with mitotracker. Images were obtained using confocal microscope with × 40 objective.
Fig. 9
Fig. 9
BCO1 immunoreactivity in intestinal sections. Strongest immunoreactivity in duodenum (antibody dilution 1:1000) (A) with less reactivity in jejunum (B) and ileum (C) (antibody dilution 1:500). Villus, crypt, and muscular cells show diffuse presence. Strong presence in Brunner’s glands (circled) and endothelial cells (arrows).
Fig. 10
Fig. 10
BCO2 immunoreactivity in intestinal sections. Strongest immunoreactivity of BCO2 (1:750) in duodenum (A) with less reactivity in jejunum (B) and ileum (C). Diffuse pattern in villi, crypt, and muscle cells. Strong reactivity in endothelial cells (arrows).
Fig. 11
Fig. 11
Immunoreactivity of BCO1 and BCO2 in specific epithelial cells in the small intestine. Strong, punctuate presence in specific epithelial cells (arrows) along villi with BCO1 (1:500; A). BCO2 (1:500) presence in a strong punctuate pattern in specific epithelial cells (arrows) along villi (B). BCO2 presence in a strong punctuate pattern in specific cells (arrows) along Peyer’s patches (C).

References

    1. Ross AC, Harrison EH. In: Handbook of Vitamins. 5th ed. Zempleni J, Suttie JW, Gregory JF III, Stover PJ, editors. CRC Press; 2014. pp. 1–49.
    1. Gudas LJ. Biochim. Biophys. Acta. 2012;1821:213–221. - PMC - PubMed
    1. Saari JC. Annu. Rev. Nutr. 2012;32:125–145. - PubMed
    1. Balmer JE, Blomhoff R. J. Lipid Res. 2002;43:1773–1808. - PubMed
    1. Chambon P. FASEB J. 1996;10:940–954. - PubMed

Publication types

Substances

LinkOut - more resources