. 2015 Feb 15;93(4):470-81.
doi: 10.1016/j.bcp.2014.12.017. Epub 2015 Jan 6.

Covalent adduct formation between the plasmalogen-derived modification product 2-chlorohexadecanal and phloretin

Affiliations

Covalent adduct formation between the plasmalogen-derived modification product 2-chlorohexadecanal and phloretin

Andreas Üllen et al. Biochem Pharmacol. .

Abstract

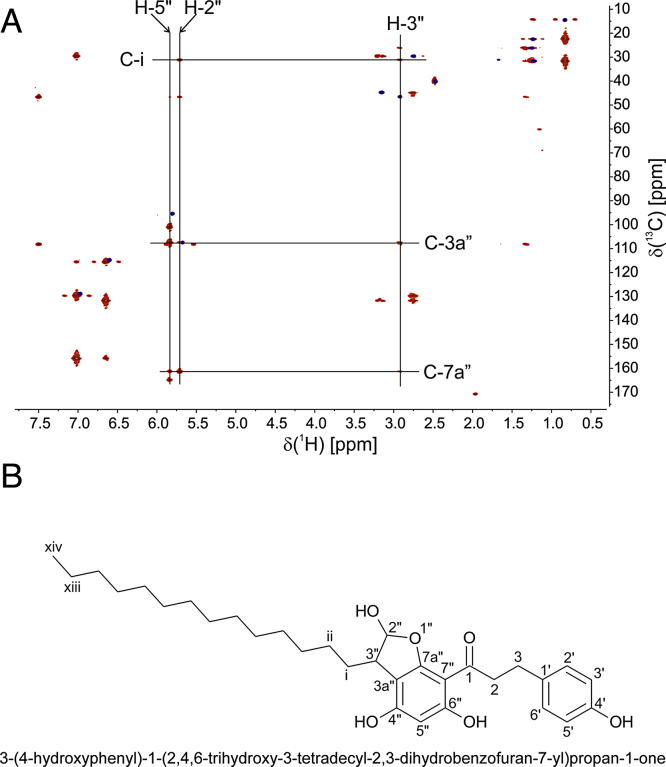
Hypochlorous acid added as reagent or generated by the myeloperoxidase (MPO)-H2O2-Cl(-) system oxidatively modifies brain ether-phospholipids (plasmalogens). This reaction generates a sn2-acyl-lysophospholipid and chlorinated fatty aldehydes. 2-Chlorohexadecanal (2-ClHDA), a prototypic member of chlorinated long-chain fatty aldehydes, has potent neurotoxic potential by inflicting blood-brain barrier (BBB) damage. During earlier studies we could show that the dihydrochalcone-type polyphenol phloretin attenuated 2-ClHDA-induced BBB dysfunction. To clarify the underlying mechanism(s) we now investigated the possibility of covalent adduct formation between 2-ClHDA and phloretin. Coincubation of 2-ClHDA and phloretin in phosphatidylcholine liposomes revealed a half-life of 2-ClHDA of approx. 120min, decaying at a rate of 5.9×10(-3)min(-1). NMR studies and enthalpy calculations suggested that 2-ClHDA-phloretin adduct formation occurs via electrophilic aromatic substitution followed by hemiacetal formation on the A-ring of phloretin. Adduct characterization by high-resolution mass spectroscopy confirmed these results. In contrast to 2-ClHDA, the covalent 2-ClHDA-phloretin adduct was without adverse effects on MTT reduction (an indicator for metabolic activity), cellular adenine nucleotide content, and barrier function of brain microvascular endothelial cells (BMVEC). Of note, 2-ClHDA-phloretin adduct formation was also observed in BMVEC cultures. Intraperitoneal application and subsequent GC-MS analysis of brain lipid extracts revealed that phloretin is able to penetrate the BBB of C57BL/6J mice. Data of the present study indicate that phloretin scavenges 2-ClHDA, thereby attenuating 2-ClHDA-mediated brain endothelial cell dysfunction. We here identify a detoxification pathway for a prototypic chlorinated fatty aldehyde (generated via the MPO axis) that compromises BBB function in vitro and in vivo.

Keywords: Blood–brain barrier; Chlorinated fatty aldehyde; Myeloperoxidase; Neuroinflammation; Plasmalogens.


Figures

None
Graphical abstract
Fig. 1
Fig. 1
Analyte recovery during 2-ClHDA-phloretin adduct formation. (A) Phloretin structure. The A- and B-ring is indicated. (B) DPPC liposomes containing 2-ClHDA and phloretin were incubated at 37 °C in PBS. (C) 2-ClHDA and phloretin were incubated in acetonitrile (containing 0.1% triethylamine) at 37 °C. (D) 2-ClHDA and phloretin were incubated in PBS containing 250 μg HDL protein/ml at 37 °C. At the indicated time points aliquots of the reaction mixture were extracted, and either converted to the corresponding PFB-oxime derivatives and analyzed by NICI–GC–MS using 2-Cl[13C8]HDA as internal standard (B) or were quantitated by HPLC analysis (C and D) using external calibration. Results are presented as percentage recovery of the corresponding analytes. Results represent mean ± SD from triplicate experiments.
Fig. 2
Fig. 2
NMR analysis of the 2-ClHDA-phloretin adduct. (A) Overlay of the HSQC (blue) and HMBC (red) spectra of the 2-ClHDA-phloretin adduct. Key connectivities are indicated. (B) Adduct structure, name, and numbering scheme as applied in A and Table 1.
Fig. 3
Fig. 3
Theoretical enthalpy calculations based on NMR data. (A) Overall energy profile for the formation of the 2-ClHDA-phloretin adduct via electrophilic aromatic substitution followed by hemiacetal formation (Pathway A; 1 = 2-ClHDA, 2 = phloretin (for structure see Fig. 1A), 3 = adduct (for complete structure see Fig. 2B). To simplify enthalpy calculations R and R′ = CH3. (B) Under slightly basic conditions the A-ring of phloretin (2) is dissociated (2′ and 2″) and thus activated for electrophilic aromatic substitution. 2″ is more stable than 2′ (11.3 kcal/mole). (C) Energy profile (upper panel) for the formation of the 2-ClHDA-phloretin adduct via electrophilic aromatic substitution followed by hemiacetal formation (Pathway A). Relative free energy (in kcal/mol) with respect to 1 and 2″ are calculated at the B3LYP/6-311G(d,p) level. The ball and stick model (lower panel) shows optimized geometry of the key transition states involved in the formation of the 2-ClHDA-phloretin adduct via Pathway A (calculated distances are given in Å). (D) Energy profile (upper panel) for the formation of the 2-ClHDA-phloretin adduct via hemiacetal formation and subsequent electrophilic aromatic substitution (Pathway B). Relative free energy with respect to 1 and 2″ (in kcal/mol) are calculated at the B3LYP/6-311G(d,p) level. The ball and stick model (lower panel) shows optimized geometry of the key transition state involved in the formation of the 2-ClHDA-phloretin adduct via Pathway B (calculated distances are given in Å).
Fig. 4
Fig. 4
HRMS analysis of the product obtained by reaction of 2-ClHDA with phloretin. (A) MALDI-TOF mass spectrum of the 2-ClHDA-phloretin adduct. The insets display the calculated isotope pattern of [C31H44O6Na]+ (a), and the accurate mass data obtained experimentally (b). (B) Direct inlet-EI mass spectrum of the 2-ClHDA-phloretin adduct. The insets display the calculated isotope pattern of [C31H44O6]+ (a), and the accurate mass data obtained experimentally (b).
Fig. 5
Fig. 5
Phloretin ameliorates cytotoxic properties of 2-ClHDA on brain endothelial cells. (A) Results for MTT reduction in the presence of the indicated compounds are expressed as % of vehicle control (‘V’; DMSO, 0.4%) and represent mean ± SD from seven independent determinations. *** p < 0.001 vs. vehicle treatment; ###p < 0.001 vs. equal 2-ClHDA concentrations; one-way ANOVA and Bonferroni comparison). (B) Cellular adenine nucleotide levels (ATP, ADP, and AMP) were analyzed in the presence of the indicated compounds (25 μM) by HPLC. Vc = vehicle control. Results represent mean ± SD from six dishes. *** p < 0.001 vs. vehicle treatment, one-way ANOVA and Bonferroni comparison. (C) ATP/ADP ratios in the presence of the indicated compounds (25 μM). *** p < 0.001 vs. vehicle treatment, one-way ANOVA and Bonferroni comparison; n.s. = not significant. (D) BMVEC were plated on gold microelectrodes and cultured to confluence. Impedance of hydrocortisone-induced monolayers (7.5 × 104 cells) was continuously monitored at 4 kHz. After monolayer stabilization, cells were incubated with vehicle (DMSO, 0.2%; ‘1’), phloretin (15 μM; ‘2’), 2-ClHDA (15 μM; ‘3’), or purified 2-ClHDA-phloretin adduct (15 μM; ‘4’). Impedance was monitored over 4 h. The arrow indicates addition of compounds. (E). Statistical evaluation of relative impedance values (1–4) after 4 h from (D). Impedance values were normalized to treatment start and represent mean values ± SD of four independent experiments (*** p < 0.001 vs. vehicle treatment; ###p < 0.001 vs. 2-ClHDA; one-way ANOVA and Bonferroni comparison). (F) BMVEC were incubated with 2-ClHDA (15 μM) or 2-ClHDA plus phloretin (15 μM each). Aliquots of cell lysates (50 μg protein/lane) were subjected to SDS-PAGE and transferred to PVDF membranes. Pan- or phospho-specific polyclonal antibodies against p44/42 or SAPK1/JNK1/2 were used as primary antibodies. Immunoreactive bands were visualized with HRP-conjugated secondary antibodies using the Bio Rad ChemiDoc system.
Fig. 6
Fig. 6
Phloretin accumulation in murine brain after i.p. administration. C57BL/6J mice (n = 3/group) received a single injection (i.p.) of phloretin (0.1 mg/g body weight). At the indicated times brains were removed, homogenized, extracted, and phloretin was analyzed by EI–GC–MS analysis in the SIM mode and quantitated using resveratrol as internal standard. (A) SIM trace of a representative brain lipid sample (15 min post phloretin application) containing resveratrol as internal standard. Phloretin (a) was monitored at m/z 562 [M+] and 547 [M+ − CH3], resveratrol (b) was monitored at m/z 444.3 [M+]. Note coelution of trans-resveratrol with phloretin. Fragment ion intensity ratios of phloretin and the internal standard are shown in (c). Mass assignment for the major fragments is indicated. (B) Time-dependent quantitation of phloretin in mouse brain homogenates after i.p. application. Results shown represent mean ± SD from three animals per time point.

References

    1. Zlokovic B.V. The blood–brain barrier in health and chronic neurodegenerative disorders. Neuron. 2008;57:178–201. - PubMed
    1. Hawkins B.T., Davis T.P. The blood–brain barrier/neurovascular unit in health and disease. Pharmacol Rev. 2005;57:173–185. - PubMed
    1. Coisne C., Engelhardt B. Tight junctions in brain barriers during central nervous system inflammation. Antioxid Redox Signal. 2011;15:1285–1303. - PubMed
    1. Freeman L.R., Keller J.N. Oxidative stress and cerebral endothelial cells: regulation of the blood–brain-barrier and antioxidant based interventions. Biochim Biophys Acta. 2012;1822:822–829. - PMC - PubMed
    1. Blasig I.E., Bellmann C., Cording J., Del Vecchio G., Zwanziger D., Huber O. Occludin protein family: oxidative stress and reducing conditions. Antioxid Redox Signal. 2011;15:1195–1219. - PubMed

Publication types

MeSH terms