

Characterization of the mutational landscape of anaplastic thyroid cancer via whole-exome sequencing
- PMID: 25576899
- PMCID: PMC4380073
- DOI: 10.1093/hmg/ddu749
Characterization of the mutational landscape of anaplastic thyroid cancer via whole-exome sequencing
Abstract
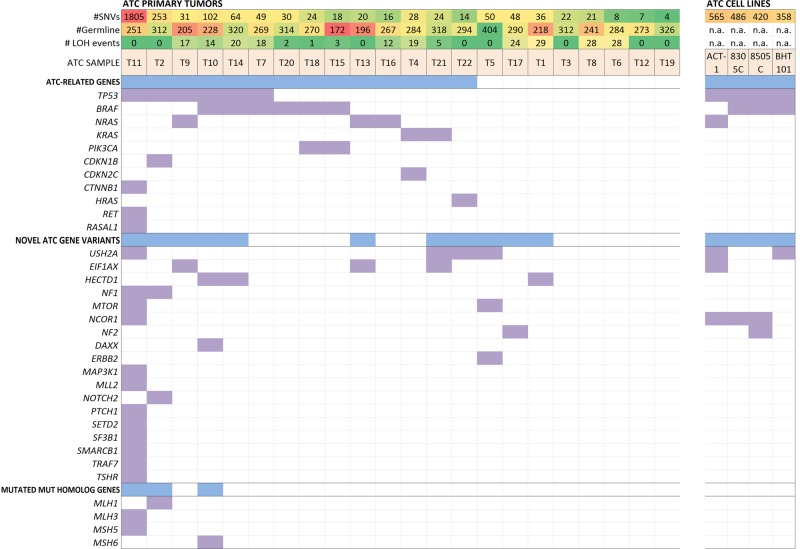
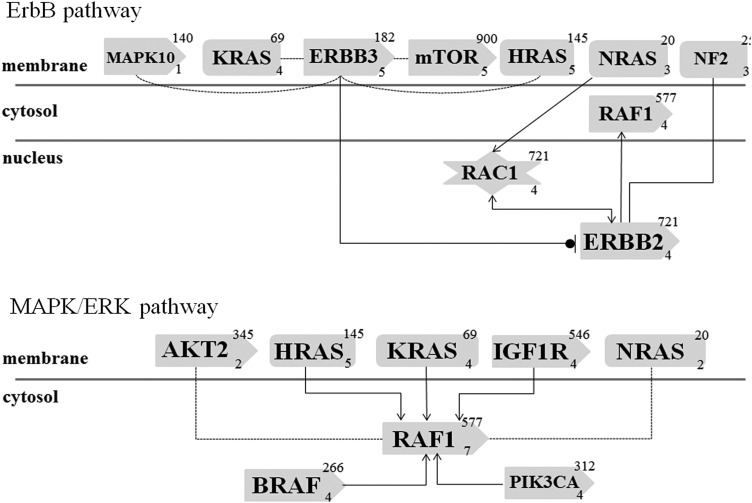
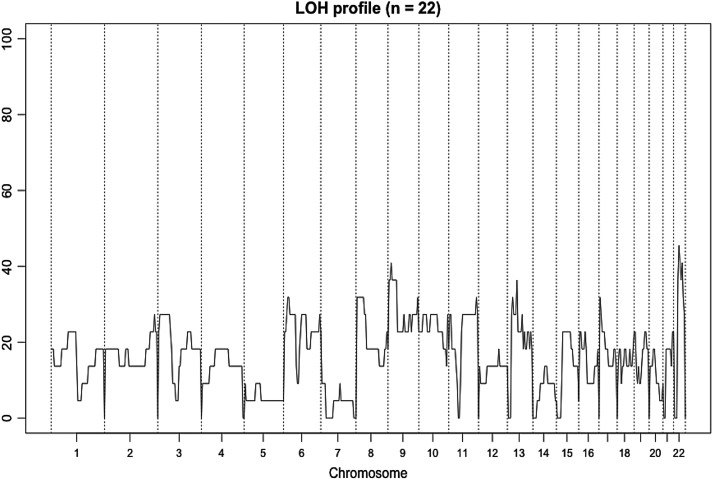
Anaplastic thyroid carcinoma (ATC) is a frequently lethal malignancy that is often unresponsive to available therapeutic strategies. The tumorigenesis of ATC and its relationship to the widely prevalent well-differentiated thyroid carcinomas are unclear. We have analyzed 22 cases of ATC as well as 4 established ATC cell lines using whole-exome sequencing. A total of 2674 somatic mutations (121/sample) were detected. Ontology analysis revealed that the majority of variants aggregated in the MAPK, ErbB and RAS signaling pathways. Mutations in genes related to malignancy not previously associated with thyroid tumorigenesis were observed, including mTOR, NF1, NF2, MLH1, MLH3, MSH5, MSH6, ERBB2, EIF1AX and USH2A; some of which were recurrent and were investigated in 24 additional ATC cases and 8 ATC cell lines. Somatic mutations in established thyroid cancer genes were detected in 14 of 22 (64%) tumors and included recurrent mutations in BRAF, TP53 and RAS-family genes (6 cases each), as well as PIK3CA (2 cases) and single cases of CDKN1B, CDKN2C, CTNNB1 and RET mutations. BRAF V600E and RAS mutations were mutually exclusive; all ATC cell lines exhibited a combination of mutations in either BRAF and TP53 or NRAS and TP53. A hypermutator phenotype in two cases with >8 times higher mutational burden than the remaining mean was identified; both cases harbored unique somatic mutations in MLH mismatch-repair genes. This first comprehensive exome-wide analysis of the mutational landscape of ATC identifies novel genes potentially associated with ATC tumorigenesis, some of which may be targets for future therapeutic intervention.
© The Author 2015. Published by Oxford University Press. All rights reserved. For Permissions, please email: journals.permissions@oup.com.
Figures
References
-
- McIver B., Hay I.D., Giuffrida D.F., Dvorak C.E., Grant C.S., Thompson G.B., van Heerden J.A., Goellner J.R. (2001) Anaplastic thyroid carcinoma: a 50-year experience at a single institution. Surgery, 130, 1028–1034. - PubMed
-
- Smallridge R.C., Ain K.B., Asa S.L., Bible K.C., Brierley J.D., Burman K.D., Kebebew E., Lee N.Y., Nikiforov Y.E., Rosenthal M.S., et al. (2012) American Thyroid Association guidelines for management of patients with anaplastic thyroid cancer. Thyroid, 22, 1104–1139. - PubMed
-
- Sugitani I., Miyauchi A., Sugino K., Okamoto T., Yoshida A., Suzuki S. (2012) Prognostic factors and treatment outcomes for anaplastic thyroid carcinoma: ATC Research Consortium of Japan cohort study of 677 patients. World J. Surg., 36, 1247–1254. - PubMed
Publication types
MeSH terms
Substances
Grants and funding
LinkOut - more resources
Full Text Sources
Other Literature Sources
Medical
Research Materials
Miscellaneous
