

Increased extracellular volume and altered mechanics are associated with LVH in hypertensive heart disease, not hypertension alone
- PMID: 25577446
- PMCID: PMC4418794
- DOI: 10.1016/j.jcmg.2014.09.020
Increased extracellular volume and altered mechanics are associated with LVH in hypertensive heart disease, not hypertension alone
Abstract
Objectives: The goal of this study was to assess the relationship among extracellular volume (ECV), native T1, and systolic strain in hypertensive patients with left ventricular hypertrophy (HTN LVH), hypertensive patients without LVH (HTN non-LVH), and normotensive controls.
Background: Diffuse myocardial fibrosis in HTN LVH patients, as reflected by increased ECV and native T1, may be an underlying mechanism contributing to increased cardiovascular risk compared with HTN non-LVH subjects and controls. Furthermore, increased diffuse fibrosis in HTN LVH subjects may be associated with reduced peak systolic and early diastolic strain rate compared with the other 2 groups.
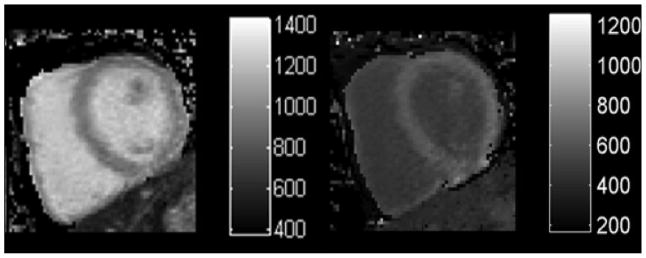
Methods: T1 mapping was performed in 20 HTN LVH (mean age, 55 ± 11 years), 23 HTN non-LVH (mean age, 61 ± 12 years), and 22 control subjects (mean age, 54 ± 7 years) on a Siemens 1.5-T Avanto (Siemens Healthcare, Erlangen, Germany) using a previously validated modified look-locker inversion-recovery pulse sequence. T1 was measured pre-contrast and 10, 15, and 20 min after injection of 0.15 mmol/kg gadopentetate dimeglumine, and the mean ECV and native T1 were determined for each subject. Measurement of circumferential strain parameters were performed using cine displacement encoding with stimulated echoes.
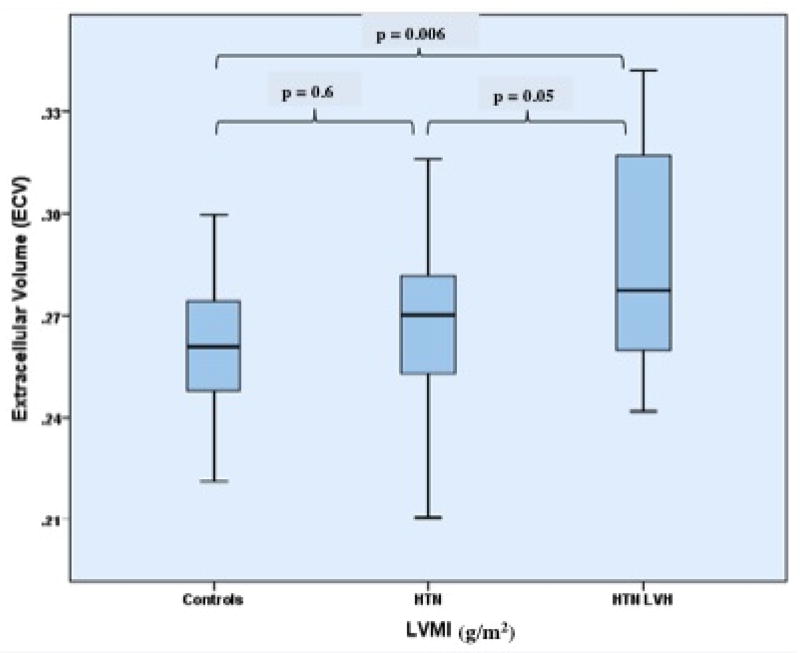
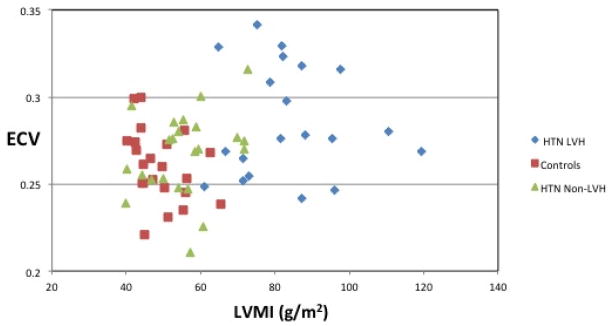
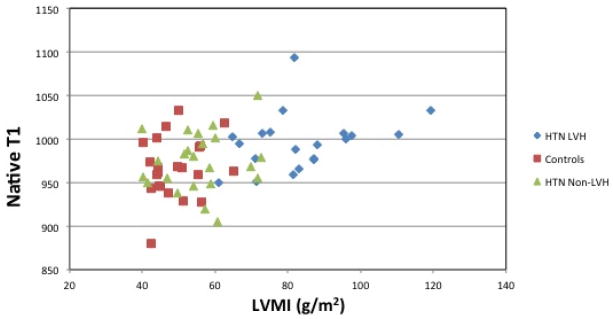
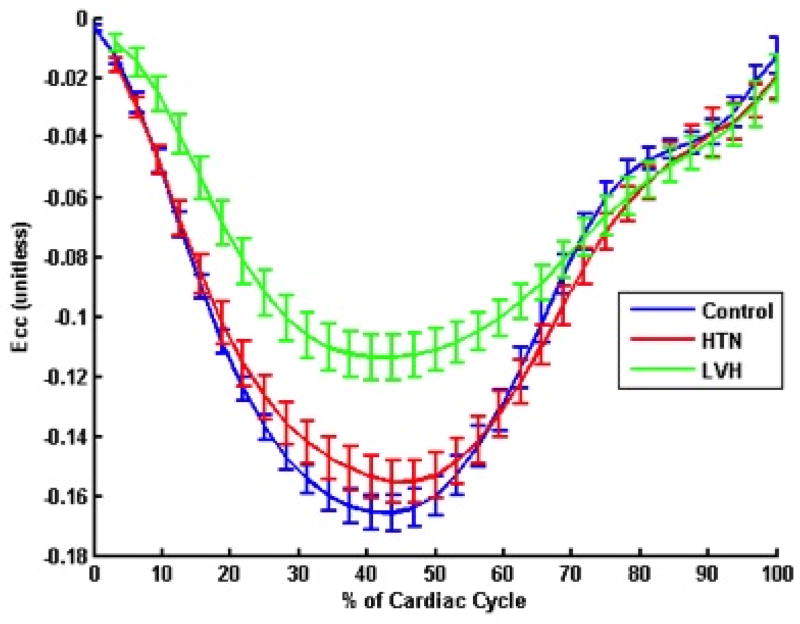
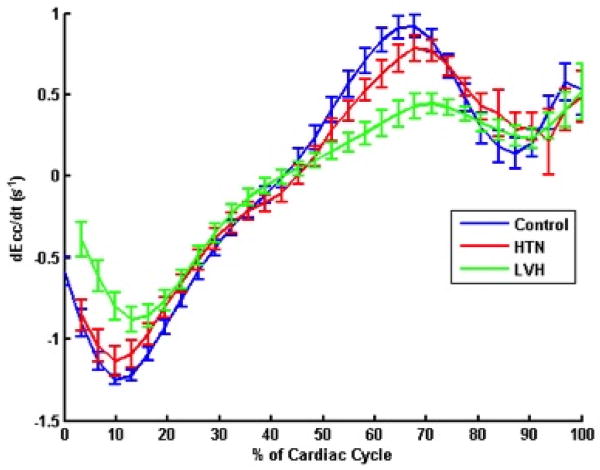
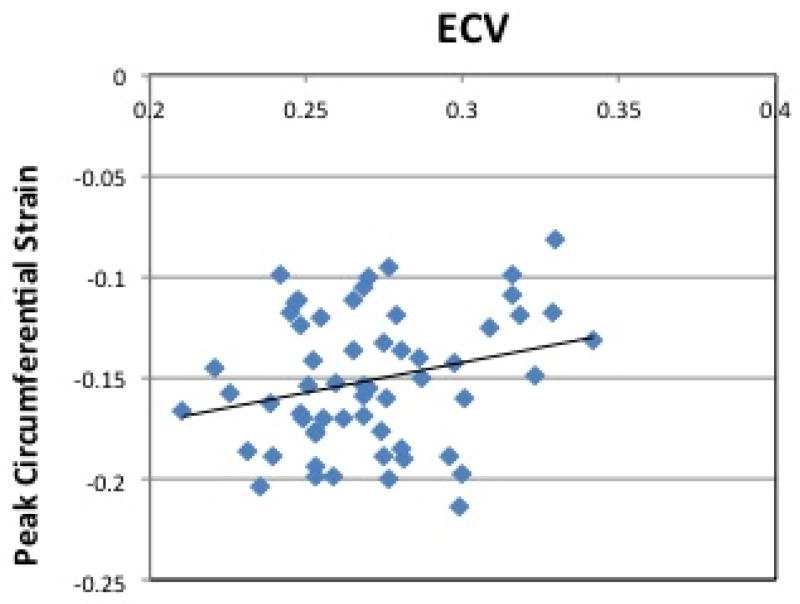
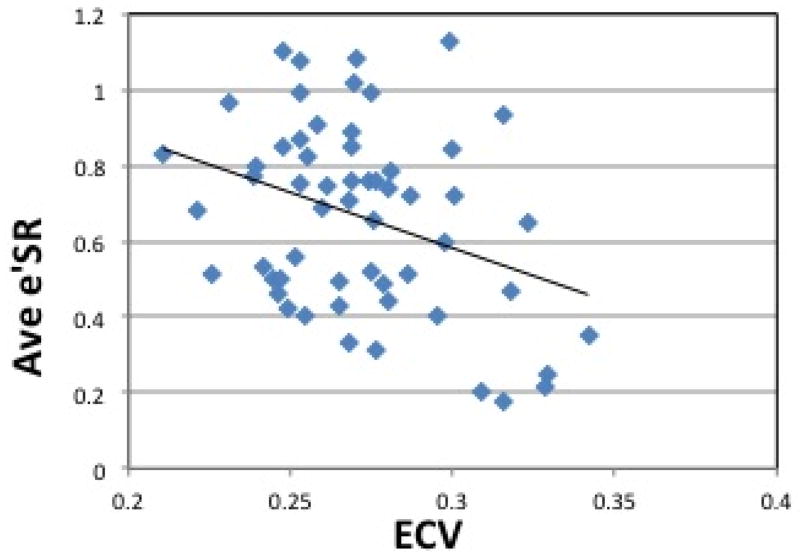
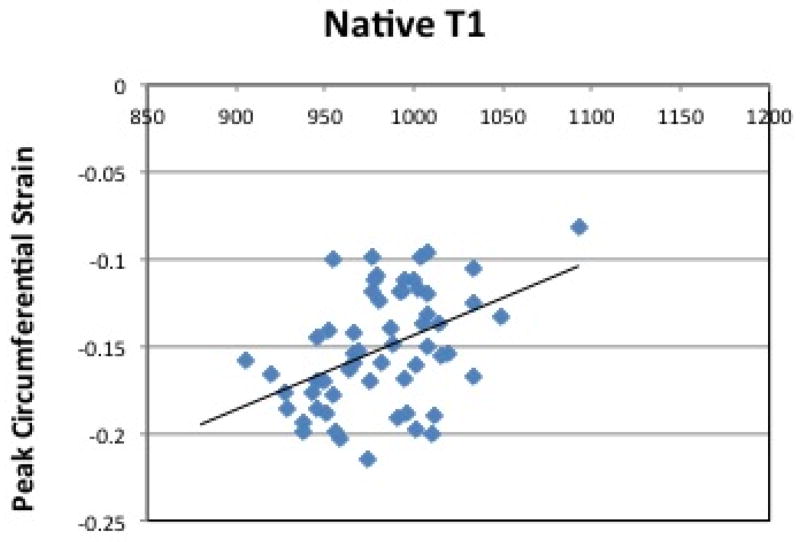
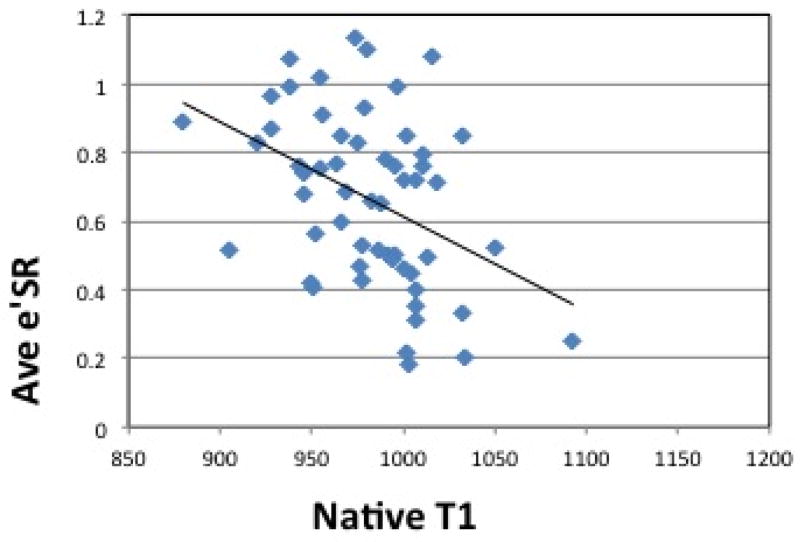
Results: HTN LVH subjects had higher native T1 compared with controls (p < 0.05). HTN LVH subjects had higher ECV compared with HTN non-LVH subjects and controls (p < 0.05). Peak systolic circumferential strain and early diastolic strain rates were reduced in HTN LVH subjects compared with HTN non-LVH subjects and controls (p < 0.05). Increased levels of ECV and native T1 were associated with reduced peak systolic and early diastolic circumferential strain rate across all subjects.
Conclusions: HTN LVH patients had higher ECV, longer native T1 and associated reduction in peak systolic circumferential strain, and early diastolic strain rate compared with HTN non-LVH and control subjects. Measurement of ECV and native T1 provide a noninvasive assessment of diffuse fibrosis in hypertensive heart disease.
Keywords: T1 mapping; cardiac magnetic resonance; extracellular volume; hypertension; hypertensive heart disease; left ventricular hypertrophy; myocardial fibrosis.
Copyright © 2015 American College of Cardiology Foundation. Published by Elsevier Inc. All rights reserved.
Figures
Comment in
-
CMR imaging of extracellular volume and myocardial strain in hypertensive heart disease.JACC Cardiovasc Imaging. 2015 Feb;8(2):181-3. doi: 10.1016/j.jcmg.2014.12.002. JACC Cardiovasc Imaging. 2015. PMID: 25677890 No abstract available.
-
Extracellular Volume and Cardiac Mechanics: Have We Found a Missing Puzzle Piece?JACC Cardiovasc Imaging. 2015 Jun;8(6):748. doi: 10.1016/j.jcmg.2015.01.020. JACC Cardiovasc Imaging. 2015. PMID: 26068291 No abstract available.
-
Reply: Extracellular Volume and Cardiac Mechanics: Have We Found a Missing Puzzle Piece?JACC Cardiovasc Imaging. 2015 Jun;8(6):749. doi: 10.1016/j.jcmg.2015.01.019. JACC Cardiovasc Imaging. 2015. PMID: 26068292 No abstract available.
References
-
- Janardhanan R, Desai AS, Solomon SD. Therapeutic approaches to diastolic dysfunction. Curr Hypertens Rep. 2009;11:283–91. - PubMed
-
- Kannel WB, Gordon T, Castelli WP, Margolis JR. Electrocardiographic left ventricular hypertrophy and risk of coronary heart disease. The Framingham study. Ann Intern Med. 1970;72:813–22. - PubMed
-
- Levy D, Garrison RJ, Savage DD, Kannel WB, Castelli WP. Prognostic implications of echocardiographically determined left ventricular mass in the Framingham Heart Study. N Engl J Med. 1990;322:1561–6. - PubMed
-
- Querejeta R, Varo N, López B, et al. Serum carboxy-terminal propeptide of procollagen type I is a marker of myocardial fibrosis in hypertensive heart disease. Circulation. 2000;101:1729–35. - PubMed
Publication types
MeSH terms
Grants and funding
LinkOut - more resources
Full Text Sources
Other Literature Sources
Medical
