. 2015 Sep;240(9):1183-96.
doi: 10.1177/1535370214565975. Epub 2015 Jan 10.

Thyroid hormone alleviates demyelination induced by cuprizone through its role in remyelination during the remission period

Affiliations

Thyroid hormone alleviates demyelination induced by cuprizone through its role in remyelination during the remission period

Mao Zhang et al. Exp Biol Med (Maywood). 2015 Sep.

Abstract

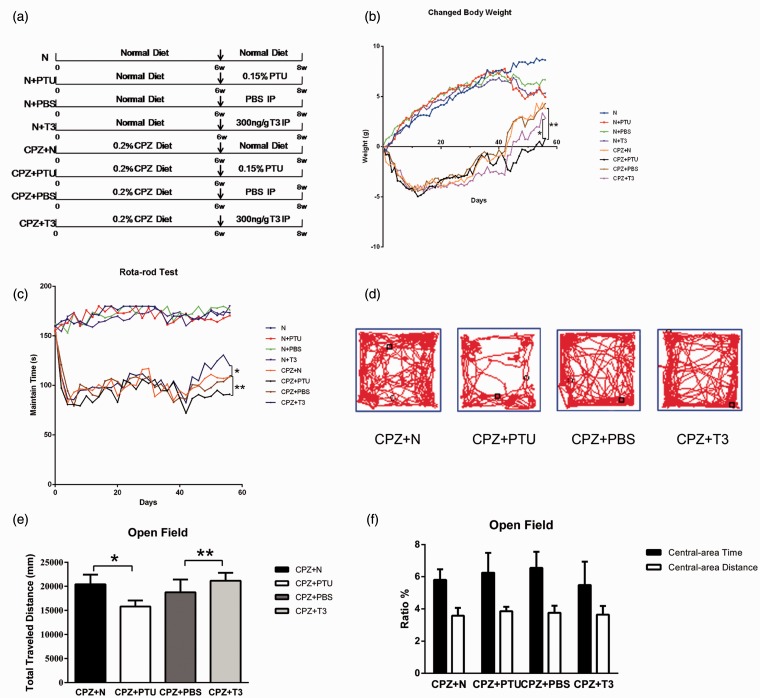
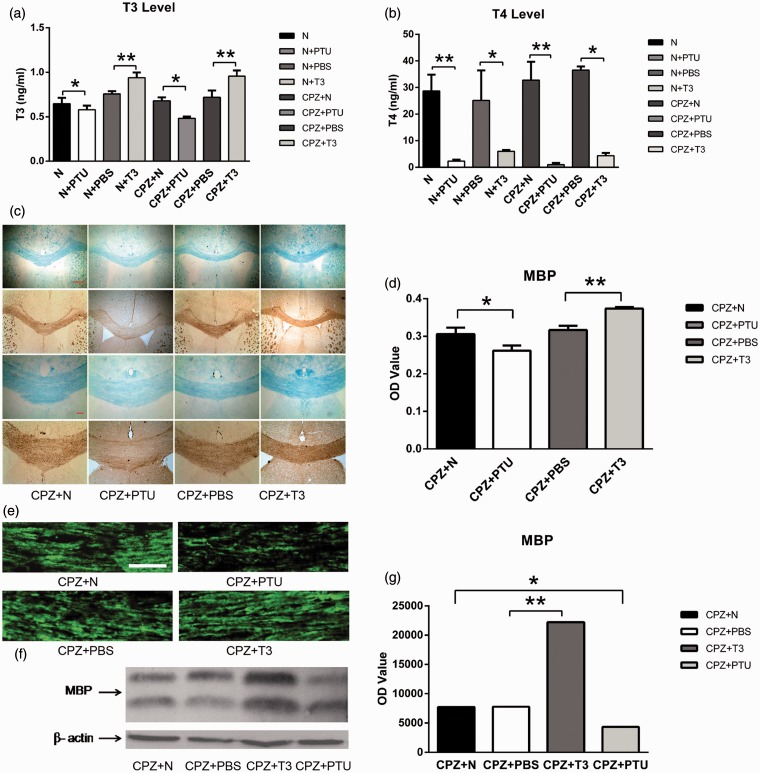
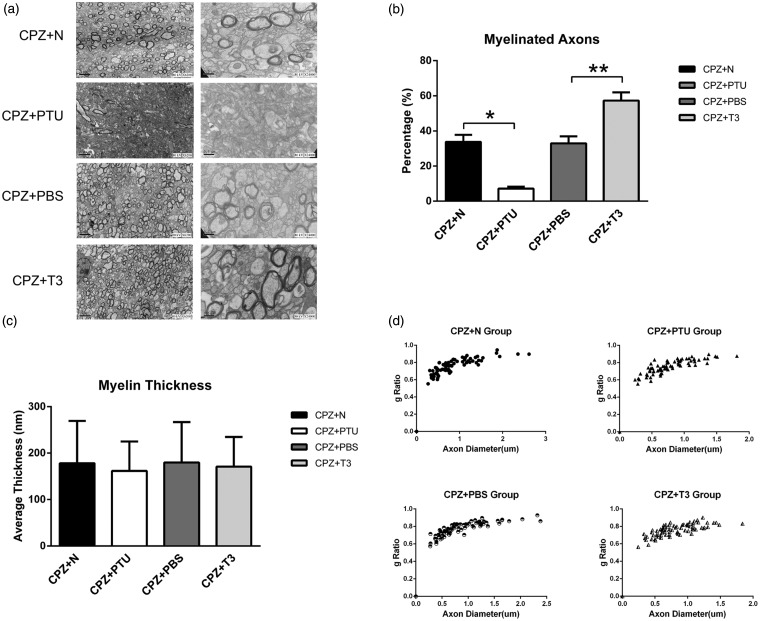
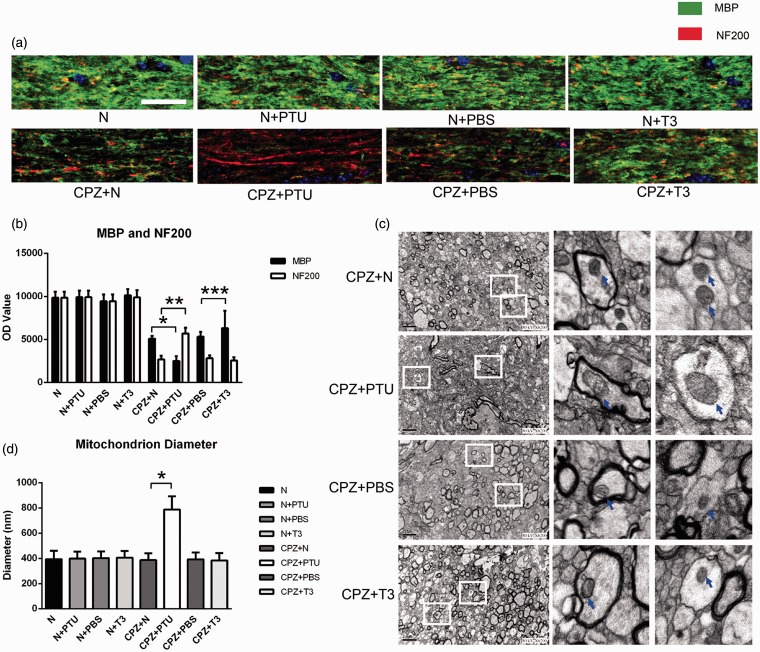
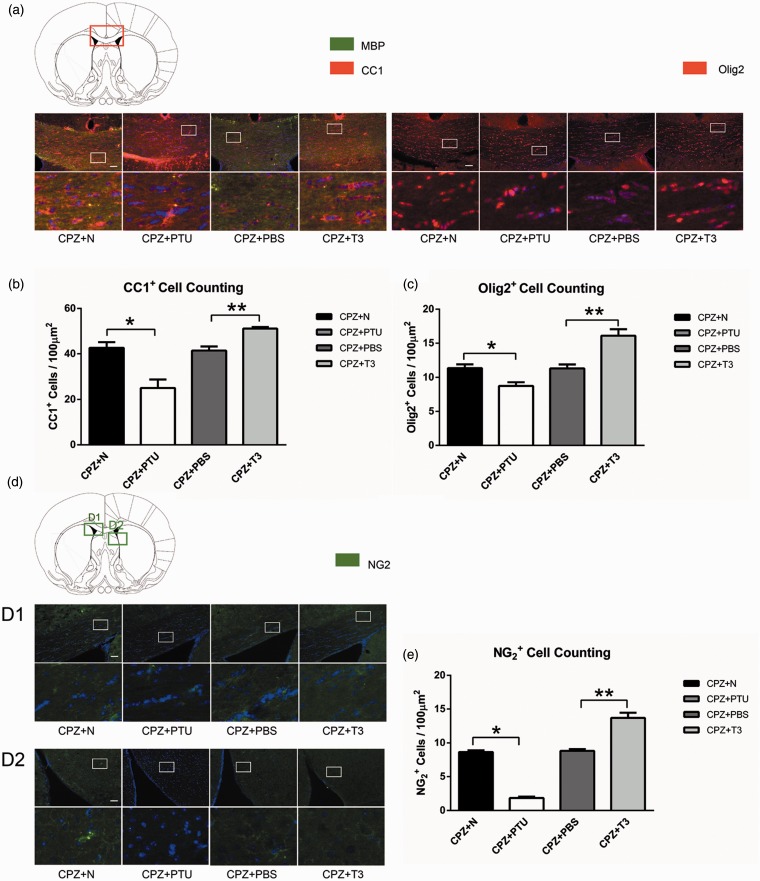
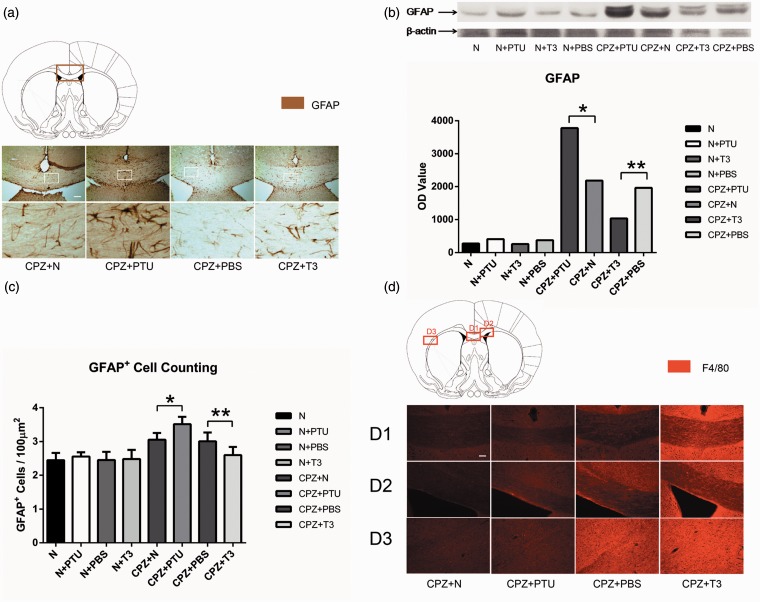
Multiple sclerosis (MS) is a disease induced by demyelination in the central nervous system, and the remission period of MS is crucial for remyelination. In addition, abnormal levels of thyroid hormone (TH) have been identified in MS. However, in the clinic, insufficient attention has been paid to the role of TH in the remission period. Indeed, TH not only functions in the development of the brain but also affects myelination. Therefore, it is necessary to observe the effect of TH on remyelination during this period. A model of demyelination induced by cuprizone (CPZ) was used to observe the function of TH in remyelination during the remission period of MS. Through weighing and behavioral tests, we found that TH improved the physical symptoms of mice impaired by CPZ. Supplementation of TH led to the repair of myelin as detected by immunohistochemistry and western blot. In addition, a sufficient TH supply resulted in an increase in myelinated axons without affecting myelin thickness and g ratio in the corpus callosum, as detected by electron microscopy. Double immunostaining with myelin basic protein and neurofilament 200 (NF200) showed that the CPZ-induced impairment of axons was alleviated by TH. Conversely, insufficient TH induced by 6-propyl-2-thiouracil resulted in the enlargement of mitochondria. Furthermore, we found that an adequate supply of TH promoted the proliferation and differentiation of oligodendrocyte lineage cells by immunofluorescence, which was beneficial to remyelination. Further, we found that TH reduced the number of astrocytes without affecting microglia. Conclusively, it was shown that TH alleviated demyelination induced by CPZ by promoting the development of oligodendrocyte lineage cells and remyelination. The critical time for remyelination is the remission period of MS. TH plays a significant role in alleviating demyelination during the remission period in the clinical treatment of MS.

Keywords: Thyroid hormone; corpus callosum; multiple sclerosis; myelin; oligodendrocyte.


Figures

Figure 1
Figure 1
Thyroid hormone stimulates the recovery of body weight and behaviors impaired by CPZ. (a) The eight treatment groups are N, N+PTU, N+PBS, N+T3, CPZ+N, CPZ+PTU, CPZ+PBS, CPZ+T3 (n = 11 in each group). The N group was supplied a normal diet in eight weeks. The N+PTU, N+PBS, and the N+T3 groups were supplied a normal diet for the initial six weeks. Over the following two weeks, they received a diet with 0.15% PTU, a normal diet with 6 µL/g PBS via IP injection and a normal diet with 300 ng/g T3 via IP injection. The CPZ+N group was administered a diet with 0.2% CPZ for six weeks and normal diet for the following two weeks. The CPZ+PTU, CPZ+PBS, and CPZ+T3 groups received 0.2% CPZ for six weeks and then two weeks with a diet of 0.15% PTU, a normal diet with 6 µL/g PBS, and IP injections of 300 ng/g T3 IP injection. (b) Relative weight was recorded every day for eight groups to observe the physical condition of mice. The relative weight of mice was suppressed by CPZ in the initial six weeks. After different manipulations over the following two weeks the relative weight in the CPZ+PTU group was less than that in the CPZ+N group **P-value < 0.05. The relative weight in the CPZ+T3 group was more than that in the CPZ+PTU group *P-value < 0.05. (c) To observe the ability of motor coordination, rota-rod tests were carried out at a speed of 40 r/min for 3 min every other day. The maintain time on rota-rod for the CPZ+PTU group was shorter than in the CPZ+N group** P-value < 0.05. The maintain time of the CPZ+T3 group was longer than in the CPZ+ PBS group* P-value < 0.05. (d) Through open field tests, we recorded the trails of mice in the CPZ+N, CPZ+PTU, CPZ+PBS, and CPZ+T3 groups. These data were used to determine the distance traveled, the ratio of the central area time to the total time, and the ratio of the central area distance to the total distance. The central area was the central grid of a nine-grid diagram. (e) Statistical analysis showed that the total traveled distance in the CPZ+PTU group was shorter than in the CPZ+N group *P-value < 0.05. Trials on the CPZ+T3 group compared with the CPZ+PBS group **P-value < 0.05. (f) There were no differences in the ratio of central area time to total time and the ratio of the central area distance to the total distance among the CPZ+N, CPZ+PTU, CPZ+PBS, and CPZ+T3 groups. ANOVA Test: P-value > 0.05. (A color version of this figure is available in the online journal.)
Figure 2
Figure 2
Thyroid hormone promotes remyelination after the impairment induced by CPZ. (a) Radioimmunoassays show differences in the T3 levels between the N and N+PTU groups * P-value < 0.05, between the CPZ+N and CPZ+PTU groups * P-value < 0.05, between the N+PBS and N+T3 groups ** P-value < 0.05, between the CPZ+PBS and CPZ+T3 ** P-value < 0.05. (b) Differences in the level of T4 can be found between the N and N+PTU groups **P-value < 0.05, between the CPZ+N and CPZ+PTU groups **P-value < 0.05, between the N+PBS and N+T3 groups * P-value < 0.05, between the CPZ+PBS and CPZ+T3 groups *P-value < 0.05. (c) Pictures of LFB staining and MBP immunohistochemistry staining in the CC, scale bars = 500 and 100 µm. (d) There were differences in the OD values of MBP immunohistochemistry staining between the CPZ+N and CPZ+PTU groups *P-value < 0.05, between the CPZ+PBS and CPZ+T3 groups **P-value < 0.05. (e) Pictures of MBP immunofluorescence staining in the CC taken by confocal laser scanning microscope, scale bar = 20 µm. (df) The expression of MBP in the CC was tested by western blot. (g) Results of western blots were analyzed by OD value. The expression of MBP in CPZ+PTU group was lower than that in CPZ+N group*P-value < 0.01. However, the amount of MBP in CPZ+T3 group was higher than that in CPZ+PBS group **P-value < 0.01. (A color version of this figure is available in the online journal.)
Figure 3
Figure 3
Transmission electron microscopy of myelin in the corpus callosum. (a) Electron micrographs of the CC in the CPZ+N,CPZ+PTU, CPZ+PBS, and CPZ+T3 groups, scale bar = 2 µm at 80 kV and 0.5 µm at 80 kV. (b) There were differences in the number of myelinated axons between the CPZ+N and the CPZ+PTU groups *P-value < 0.01, between the CPZ+PBS and the CPZ+T3 groups **P-value < 0.01. (c) There were no differences in myelin thickness between the CPZ+N, CPZ+PTU, CPZ+PBS, and CPZ+T3 groups. (d) There were no differences in the g ratio as analyzed by scatter plots of these four groups P-value > 0.05
Figure 4
Figure 4
Thyroid hormone alleviates the impairment of axons induced by CPZ in corpus callosum. (a) Pictures of MBP and NF200’s double Immunofluorescence staining taken by confocal laser scanning microscope in CC, scale bar = 20 µm. (b) There were differences in the OD values of MBP immuno-positive staining between the CPZ+N and the CPZ+PTU groups *P-value < 0.01, between the CPZ+PBS and the CPZ+T3 groups ***P-value < 0.01. Differences also existed in the OD values of NF200 immuno-positive staining between the CPZ+N and the CPZ+PTU groups **P-value < 0.01. (c) Enlarged mitochondria can be found in axons of the CPZ+PTU group in electron micrographs, scale bar 2 µm 80 kV. (d) Statistical analyses reveal that the diameter of mitochondria in the CPZ+PTU group was longer than that in the CPZ+N group *P-value < 0.01. (A color version of this figure is available in the online journal.)
Figure 5
Figure 5
Thyroid hormone promotes the amount of oligodendrocyte lineage cells impaired by CPZ in the corpus callosum. (a) Double immunofluorescence staining of MBP and CC1 in the CC and immunofluorescence staining of Olig2 in the same area. Scale bar 50 µm. (b) The number of CC1 immuno-positive cells was different between the CPZ+N and the CPZ+PTU groups *P-value < 0.05, between the CPZ+PBS and the CPZ+T3 groups **P-value < 0.05. (c) There were differences in the number of Olig2 immuno-positive cells between the CPZ+N and the CPZ+PTU groups *P-value <0.01, between the CPZ+PBS and the CPZ+T3 groups **P-value < 0.01. (d) Immunofluorescence pictures of NG2 in the CC (D1) and the SVZ (D2), scale bar = 50 µm. (e) There were differences in the number of NG2 immuno-positive cells in the CC (D1) and the SVZ (D2) between CPZ+N and CPZ+PTU groups *P-value < 0.01, between the CPZ+PBS and the CPZ+T3 groups **P-value < 0.01. (A color version of this figure is available in the online journal.)
Figure 6
Figure 6
Thyroid hormone reduces active astrocytes induced by CPZ but has no effect on active microglia in the corpus callosum. (a) Images of GFAP immuno-peroxidase staining in the CC, scale bar = 100 µm. (b) The expression of GFAP in the CC was examined by western blots. The results were analyzed by OD values. The expression of GFAP in the CPZ+PTU group was higher than that in the CPZ+N group*P-value < 0.01. The amount of GFAP in the CPZ+T3 group was lower than in the CPZ+PBS group **P-value < 0.01. (c) There were differences in the number of GFAP immuno-positive cells in the CC between the CPZ+N and the CPZ+PTU groups *P-value < 0.05, between the CPZ+PBS and the CPZ+T3 groups **P-value < 0.05. (d) Immunofluorescence staining of F4/80 in several subareas of the CC including the central CC area (D1), the CC g area (D2), and the distal end of the CC area (D3). We found no differences between the CPZ+N, CPZ+PTU, CPZ+PBS, and CPZ+T3 groups, scale bar = 50 µm. (A color version of this figure is available in the online journal.)

Similar articles

Cited by

References

    1. Trapp BD, Peterson J, Ransohoff RM, Rudick R, Mork S, Bo L. Axonal transection in the lesions of multiple sclerosis. N Engl J Med 1998; 338: 278–85. - PubMed
    1. Waxman SG. Demyelinating diseases—new pathological insights, new therapeutic targets. N Engl J Med 1998; 338: 323–5. - PubMed
    1. Scolding N, Franklin R. Axon loss in multiple sclerosis. Lancet 1998; 352: 340–1. - PubMed
    1. Wingerchuk DM, Weinshenker BG. Multiple sclerosis: epidemiology, genetics, classification, natural history, and clinical outcome measures. Neuroimaging Clin N Am 2000; 10: 611–24, vii. - PubMed
    1. Kister I, Chamot E, Salter A, Cutter G, Bacon T, Kalina J, Herbert J. Natural history of MS symptoms: perceived disease impact across disease span in nine neurologic domains among enrollees in North American Research Committee on Multiple Sclerosis (NARCOMS) Registry. Neurology 2012; 78: 19–27.

Publication types

MeSH terms