. 2015 Jan 21;85(2):364-76.
doi: 10.1016/j.neuron.2014.12.022. Epub 2015 Jan 8.

Heterosynaptic regulation of external globus pallidus inputs to the subthalamic nucleus by the motor cortex

Affiliations

Heterosynaptic regulation of external globus pallidus inputs to the subthalamic nucleus by the motor cortex

Hong-Yuan Chu et al. Neuron. .

Abstract

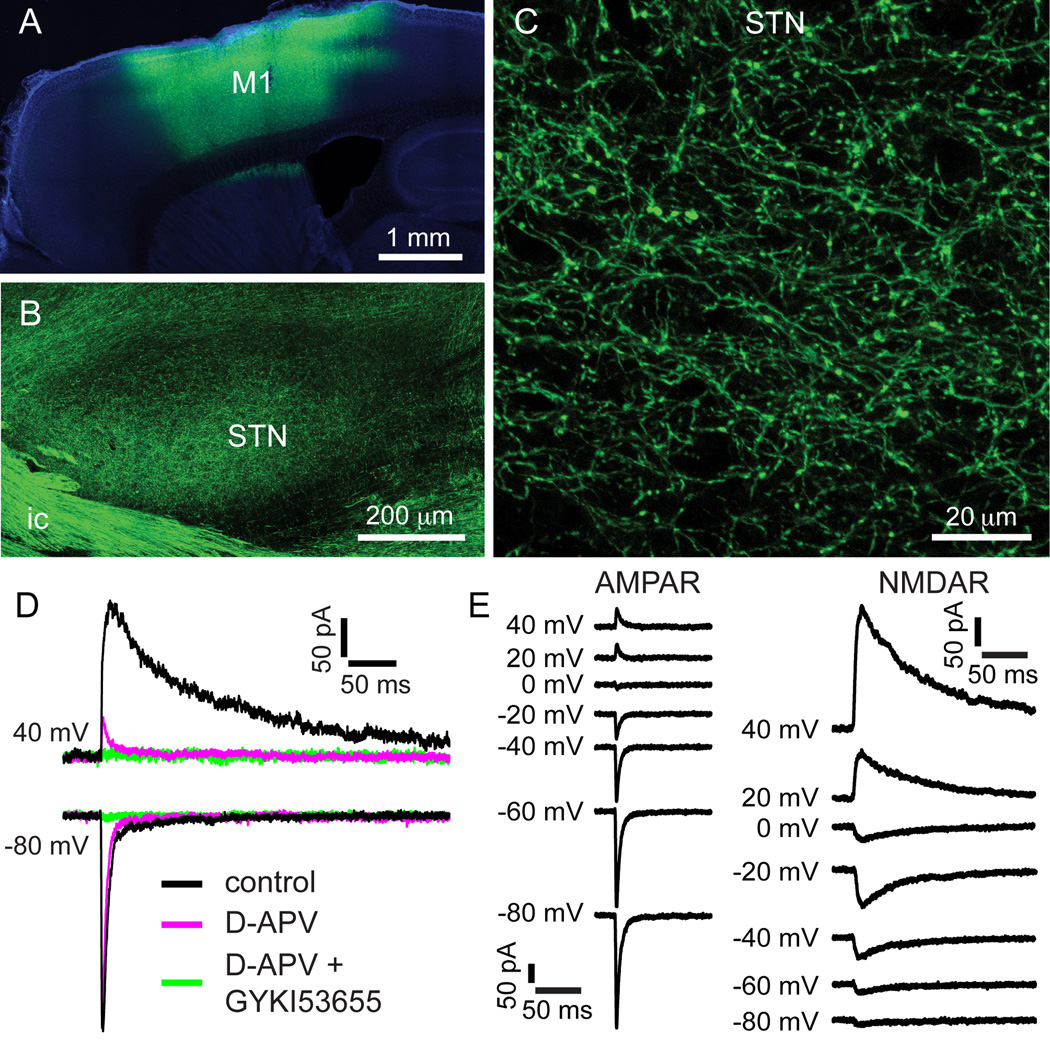
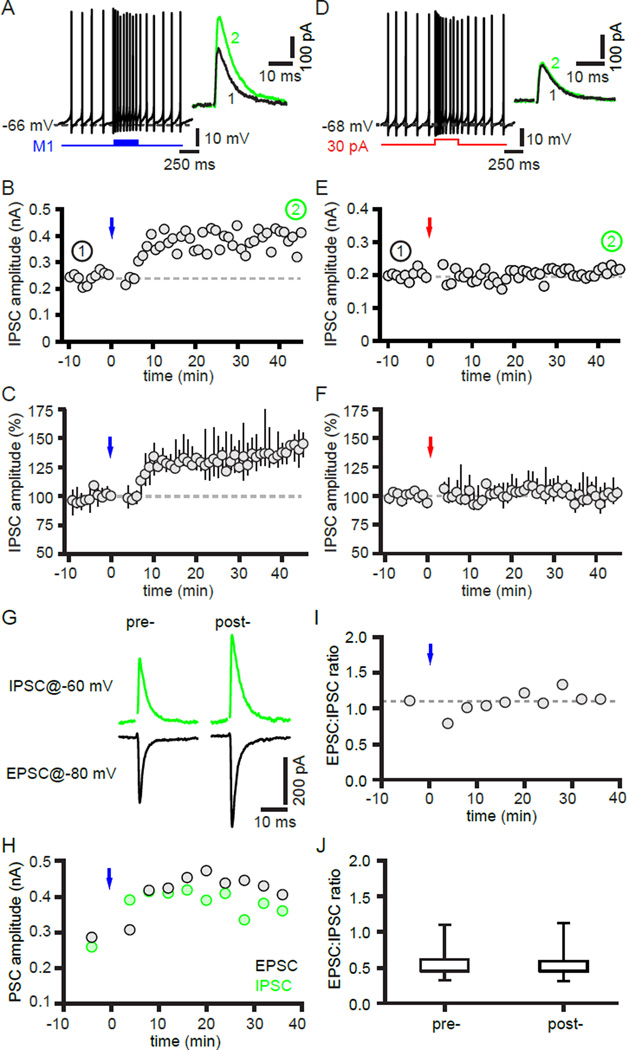
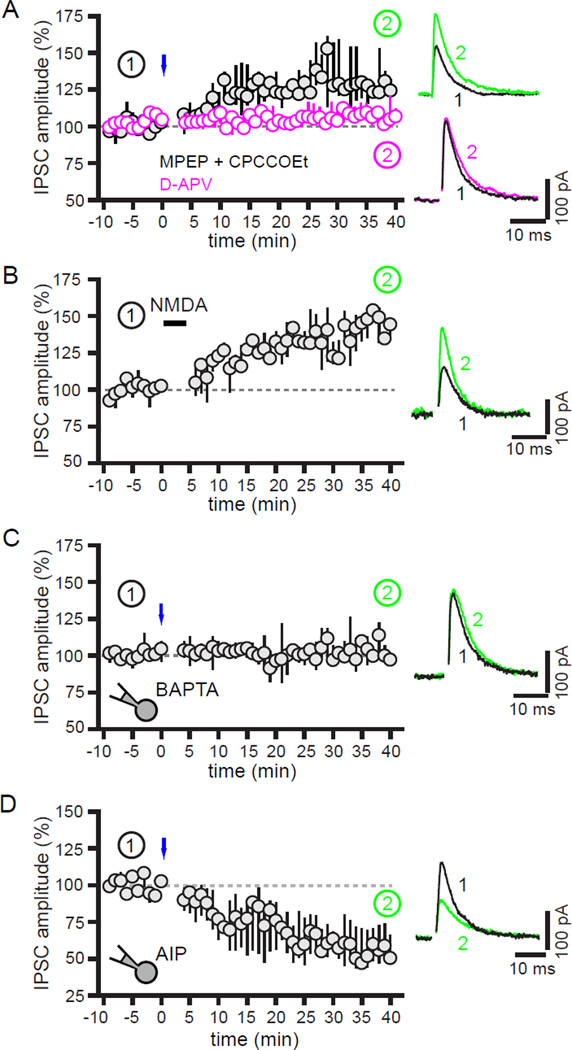
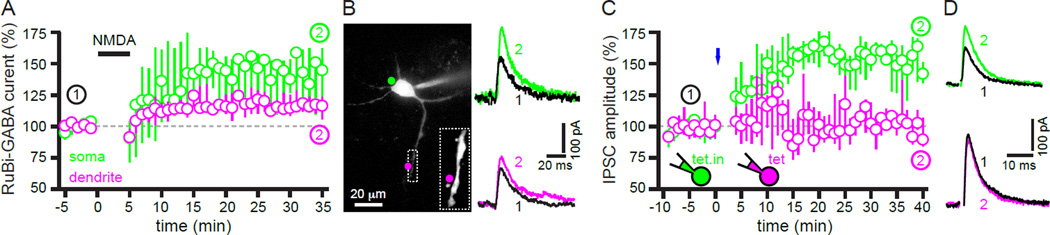
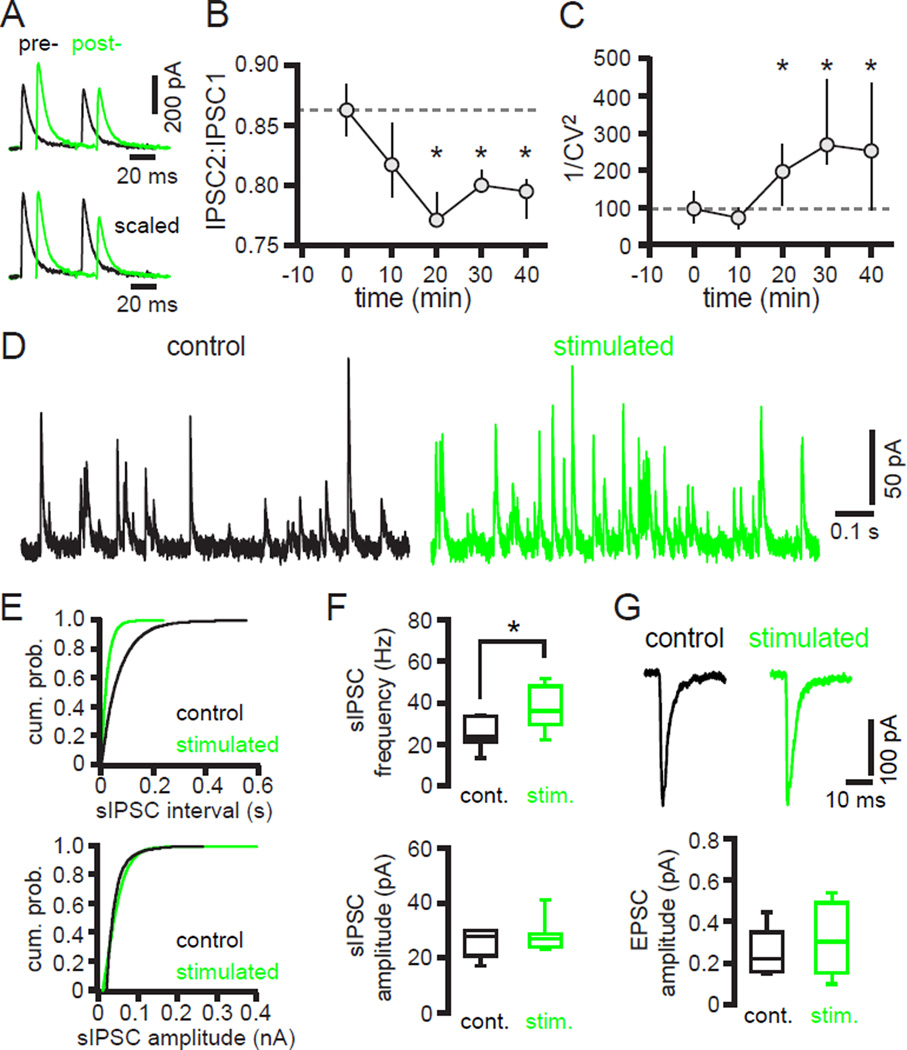
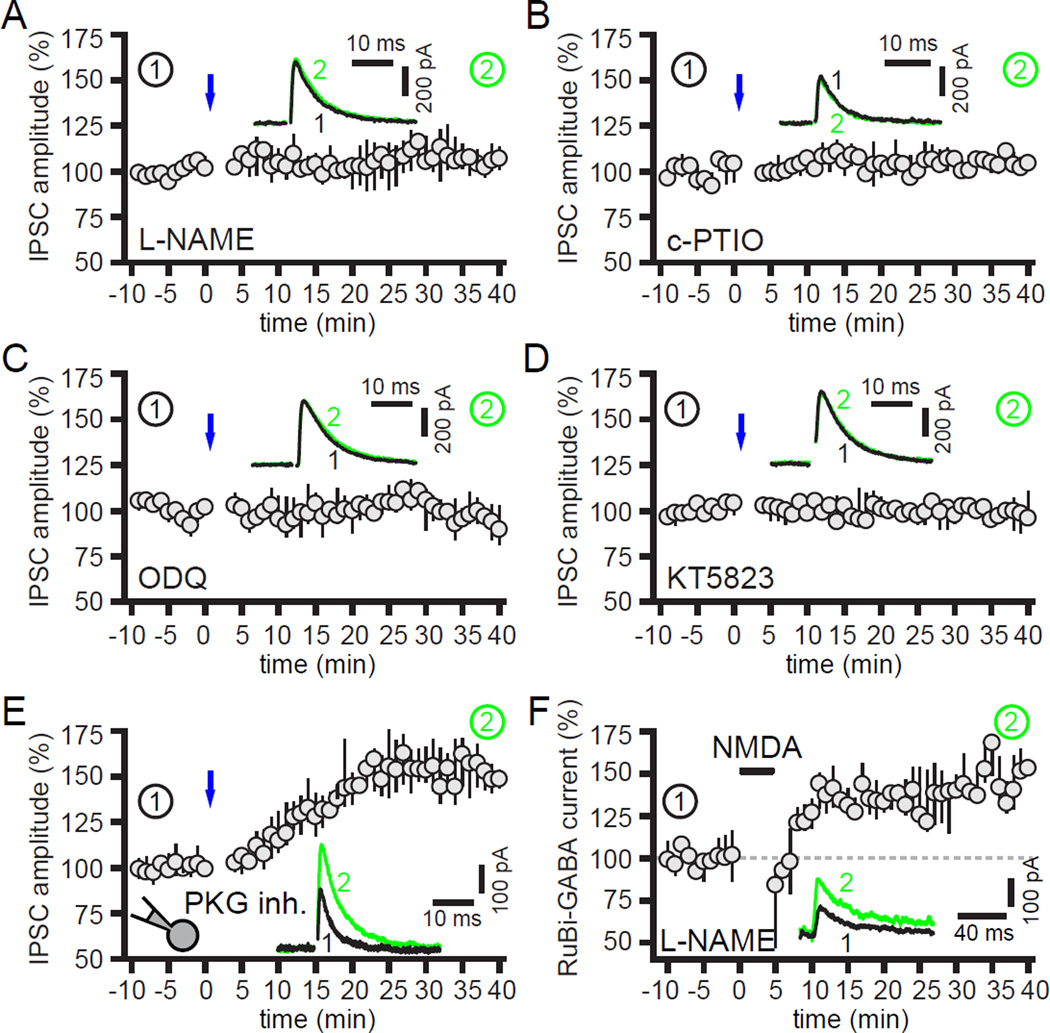
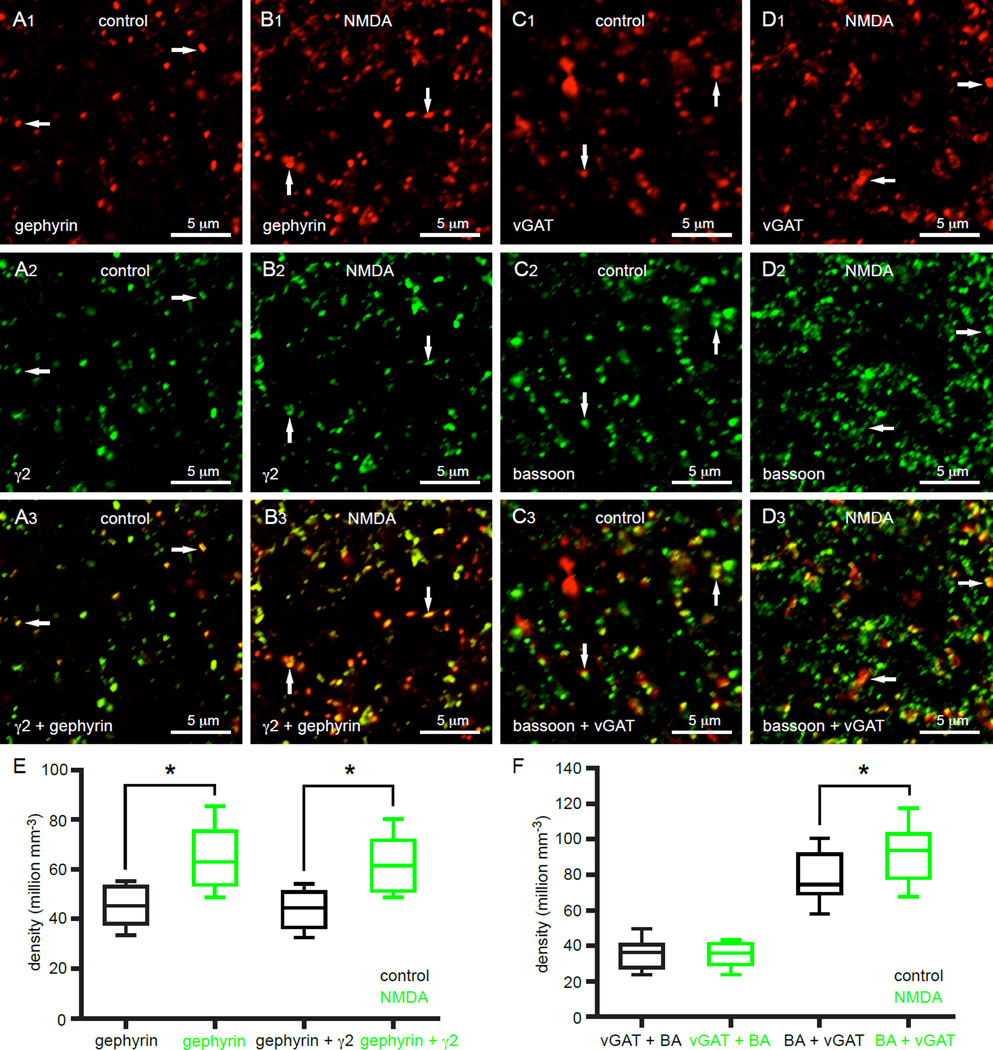
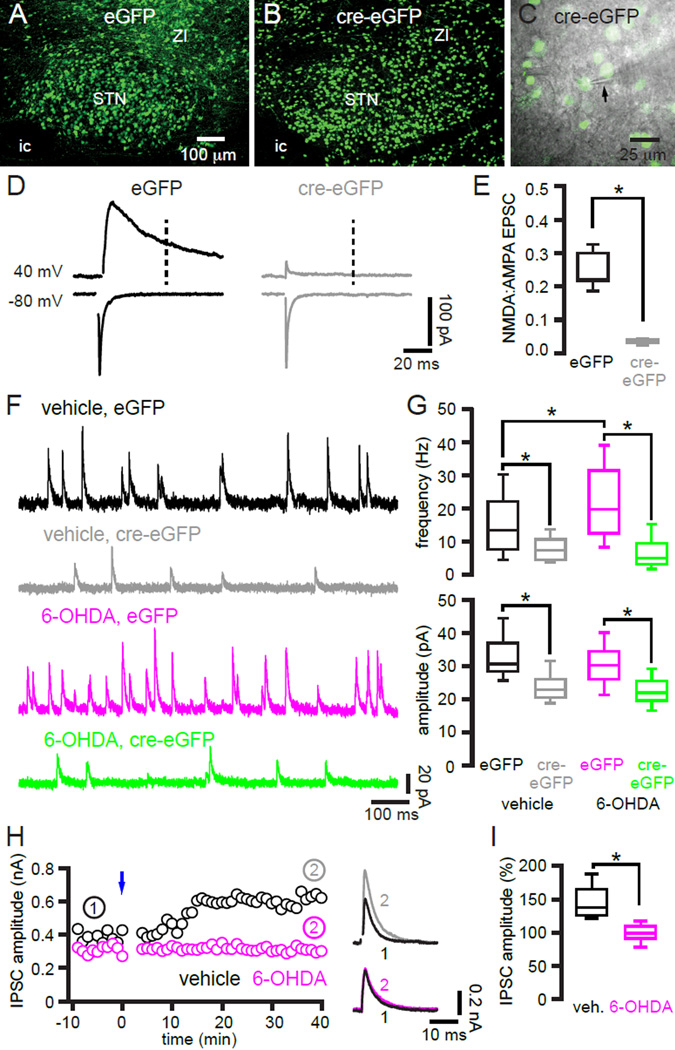
The two principal movement-suppressing pathways of the basal ganglia, the so-called hyperdirect and indirect pathways, interact within the subthalamic nucleus (STN). An appropriate level and pattern of hyperdirect pathway cortical excitation and indirect pathway external globus pallidus (GPe) inhibition of the STN are critical for normal movement and are greatly perturbed in Parkinson's disease. Here we demonstrate that motor cortical inputs to the STN heterosynaptically regulate, through activation of postsynaptic NMDA receptors, the number of functional GABAA receptor-mediated GPe-STN inputs. Therefore, a homeostatic mechanism, intrinsic to the STN, balances cortical excitation by adjusting the strength of GPe inhibition. However, following the loss of dopamine, excessive cortical activation of STN NMDA receptors triggers GPe-STN inputs to strengthen abnormally, contributing to the emergence of pathological, correlated activity.


Figures

Figure 1
Figure 1. Optogenetic stimulation of motor cortex-STN inputs
(A–C) AAV vector-mediated expression of ChR2(H134R)-eYFP centered on primary motor cortex (A; M1) and its associated projection to the STN (B, C). (B, C) Sagittal slice through the lateral motor territory of the STN. (D–E) Optogenetically stimulated motor cortex-STN EPSCs. (D) At 40 mV the EPSC was largely inhibited by the NMDAR antagonist D-APV (50 µM). At −80 mV the EPSC was largely inhibited by the additional application of the AMPAR antagonist GYKI53655 (50 µM). (E) Distinct kinetics and voltage-dependence of pharmacologically isolated AMPAR- and NMDAR-mediated motor cortex-STN EPSC components. ic, internal capsule. See also Figure S1.
Figure 2
Figure 2. Optogenetic stimulation of motor cortex-STN inputs leads to hLTP of GPe-STN transmission
(A–C) Optogenetic stimulation of motor cortical inputs (blue) drove firing in the STN (A) and led to a persistent increase in the magnitude of the electrically evoked GABAAR-mediated IPSC (A–C) both in the representative example (A–B) and across the sample population (C). (D–F) In contrast, driving STN activity to a similar degree as synaptic excitation through somatic current injection (red) did not lead to potentiation of the IPSC in the example (D–E) or sample population (F). 1 and 2 refer to time points prior to and following stimulation, respectively, in this and subsequent figures. (G–J) Optogenetically evoked motor cortex-STN EPSCs and electrically evoked GPe-STN IPSCs were monitored at −80 mV and −60 mV, respectively, in the same neuron before and after optogenetic induction. Both the IPSC and EPSC potentiated to a similar extent such that the ratio of excitation to inhibition pre- and post-induction was similar both in the representative example (G–I) and in the sample population (J). See also Figure S2.
Figure 3
Figure 3. Activation of postsynaptic NMDARs is required for hLTP of GPe-STN transmission
(A) Blockade of NMDARs with D-APV prevented optogenetic (blue) induction of LTP in contrast to the blockade of Group 1 mGluRs with CPCCOEt (50 µM) and MPEP (10 µM), which did not prevent hLTP. (B) Application of 50 µM NMDA for 5 minutes mimicked hLTP. (C–D) Inclusion in the recording pipette of the Ca2+ chelator BAPTA (20 mM) or the specific CaMKII inhibitor AIP (50 µM) prevented hLTP. In the latter case hLTP was replaced by LTD. Left panels, population time-courses. Right panels, representative examples of GPe-STN IPSCs before and after optogenetic or chemical stimulation.
Figure 4
Figure 4. hLTP of GPe-STN transmission involves the rapid SNAREdependent insertion of GABAARs into the postsynaptic membrane
(A–B) Bath application of NMDA (50 µM for 5 minutes) enhanced IPSCs generated by RuBi-GABA uncaging both at somatic (green) and dendritic (magenta) locations. (A) Population time-courses. (B) Representative example showing sites of uncaging and RuBi-GABA-evoked IPSCs before and after NMDA application. (C–D) Inclusion of the VAMP inhibitor tetanus toxin (tet.) in the recording pipette prevented hLTP following optogenetic stimulation of motor cortical inputs (blue), whereas inclusion of heat-inactivated tetanus toxin (tet.in.) did not. (C) Population time-courses. (D) Representative examples. See also Figure S3.
Figure 5
Figure 5. hLTP is associated with an increase in the probability of GPe-STN transmission
(A–C) hLTP was associated with a significant decrease in the ratio of IPSC2:IPSC1 amplitude and a significant increase in 1/CV2 of IPSC1 amplitude. (A) Representative example pre- and post-induction. (B, C) Population data. (D–F) In neurons that had received optogenetic stimulation the frequency (but not the amplitude) of spontaneous (s) GPe-STN IPSCs was greater. (D, E) Representative examples. (F) Population data. (G) The amplitude of optogenetically stimulated motor cortex-STN EPSCs was similar for neurons that did or did not receive the optogenetic induction protocol. *, p < 0.05. cum. prob., cumulative probability. stim., stimulated.
Figure 6
Figure 6. Nitric oxide (NO) signaling is necessary for hLTP
(A–E) Induction of hLTP by optogenetic stimulation of motor cortical inputs (blue) was blocked by bath application of (A) a NOS inhibitor (100 µM L-NAME), (B) a NO scavenger (30 µM c-PTIO), (C) a GC inhibitor (10 µM ODQ) or (D) a PKG inhibitor (1 µM KT5823). (E) However, inhibition of postsynaptic PKG activity by application of PKG inhibitory peptide (100 µM) via the recording pipette did not prevent hLTP. (F) Inhibition of NOS (100 µM L-NAME) also did not prevent potentiation of GABAAR current evoked by somatic uncaging of RuBi-GABA following NMDA (50 µM) administration for 5 minutes. Insets, representative IPSCs before and after optogenetic or chemical stimulation.
Figure 7
Figure 7. Activation of STN NMDARs increases the density of GABAergic postsynaptic and presynaptic markers
(A, B, E) Bath application of NMDA (50 µM for 5 minutes) increased the density of gephyrin-immunoreactive structures and the density of gephyrin-immunoreactive structures that were co-immunoreactive for the GABAAR subunit γ2 (white arrows). (C, D, F) NMDA treatment had no effect on the density of vGAT-immunoreactive structures that were co-immunoreactive for bassoon (BA). However NMDA treatment did lead to a small but significant increase in the density of bassoon-immunoreactive structures that were co-immunoreactive for vGAT (white arrows). *, p < 0.05. See also Figure S4.
Figure 8
Figure 8. NMDAR-dependent hLTP is responsible for augmented GPe-STN transmission following loss of dopamine
(A–C) AAV vector-mediated expression of (A) eGFP or (B, C) cre-eGFP in the STN of Grin1lox/lox transgenic mice. (C) eGFP was used to target patch clamp recording using 2PLSM (or epifluorescent) microscopy ex vivo. Arrow denotes electrode. (D, E) The NMDA:AMPA ratio was significantly reduced in cre-eGFP expressing STN neurons (n = 7) compared to eGFP expressing STN neurons (n = 7). Vertical dotted line denotes point at which NMDAR current was measured at 40 mV. AMPAR current was defined as peak current amplitude at −80 mV. (D) Representative examples. (E) Population data. (F, G) The frequency but not the amplitude of mIPSCs in eGFP expressing STN neurons was elevated in neurons from 6-OHDA-injected mice compared to vehicle-injected mice. Knockdown of STN NMDARs reduced the frequency and amplitude of mIPSCs in cre-eGFP expressing STN neurons relative to their respective eGFP expressing counterparts. (F) Representative examples. (G) Population data. (H–I) hLTP ex vivo was reduced, presumably due to occlusion, in neurons from 6-OHDA-injected mice compared to neurons from vehicle-injected mice both in the representative examples (H) and across the sample population (I). (I) The amplitude of the evoked IPSC post-induction (normalized to the amplitude preinduction) was significantly reduced. ic, internal capsule; ZI, zona incerta. *, p < 0.05.

Comment in

Similar articles

Cited by

References

    1. Afsharpour S. Topographical projections of the cerebral cortex to the subthalamic nucleus. J. Comp. Neurol. 1985;236:14–28. - PubMed
    1. Albin RL, Young AB, Penney JB. The functional anatomy of basal ganglia disorders. Trends Neurosci. 1989;12:366–375. - PubMed
    1. Atherton JF, Kitano K, Baufreton J, Fan K, Wokosin D, Tkatch T, Shigemoto R, Surmeier DJ, Bevan MD. Selective participation of somatodendritic HCN channels in inhibitory but not excitatory synaptic integration in neurons of the subthalamic nucleus. J. Neurosci. 2010;30:16025–16040. - PMC - PubMed
    1. Baufreton J, Atherton JF, Surmeier DJ, Bevan MD. Enhancement of excitatory synaptic integration by GABAergic inhibition in the subthalamic nucleus. J. Neurosci. 2005;25:8505–8517. - PMC - PubMed
    1. Baufreton J, Kirkham E, Atherton JF, Menard A, Magill PJ, Bolam JP, Bevan MD. Sparse but selective and potent synaptic transmission from the globus pallidus to the subthalamic nucleus. J. Neurophysiol. 2009;102:532–545. - PMC - PubMed

Publication types

MeSH terms

LinkOut - more resources