. 2015 Feb 18;43(3):1345-56.
doi: 10.1093/nar/gku1392. Epub 2015 Jan 10.

Detection of recurrent alternative splicing switches in tumor samples reveals novel signatures of cancer

Affiliations

Detection of recurrent alternative splicing switches in tumor samples reveals novel signatures of cancer

Endre Sebestyén et al. Nucleic Acids Res. .

Abstract

The determination of the alternative splicing isoforms expressed in cancer is fundamental for the development of tumor-specific molecular targets for prognosis and therapy, but it is hindered by the heterogeneity of tumors and the variability across patients. We developed a new computational method, robust to biological and technical variability, which identifies significant transcript isoform changes across multiple samples. We applied this method to more than 4000 samples from the The Cancer Genome Atlas project to obtain novel splicing signatures that are predictive for nine different cancer types, and find a specific signature for basal-like breast tumors involving the tumor-driver CTNND1. Additionally, our method identifies 244 isoform switches, for which the change occurs in the most abundant transcript. Some of these switches occur in known tumor drivers, including PPARG, CCND3, RALGDS, MITF, PRDM1, ABI1 and MYH11, for which the switch implies a change in the protein product. Moreover, some of the switches cannot be described with simple splicing events. Surprisingly, isoform switches are independent of somatic mutations, except for the tumor-suppressor FBLN2 and the oncogene MYH11. Our method reveals novel signatures of cancer in terms of transcript isoforms specifically expressed in tumors, providing novel potential molecular targets for prognosis and therapy. Data and software are available at: http://dx.doi.org/10.6084/m9.figshare.1061917 and https://bitbucket.org/regulatorygenomicsupf/iso-ktsp.


Figures

Figure 1.
Figure 1.
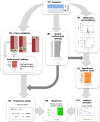
Methodology for detecting significant alternative splicing isoform changes in cancer. The method is illustrated with data from colon adenocarcinoma (COAD). (A) Samples are partitioned into two classes, here tumor (T) and normal (N). (B) The calculation of relevant isoform-pairs is based on the global ranking of isoform-pairs according to score S1 (Materials and Methods). (C) Predictive models are obtained by performing cross-validation: iteratively training in all but one pair of tumor-normal samples, and testing on this left-out pair. At each step of the cross-validation, the top k = 1, 3, 5, etc. isoform-pairs of the score S1 ranking are tested on the left-out sample pair according to a majority voting (Materials and Methods). (D) A minimal classification model is obtained by selecting the smallest number of pairs from the global ranking with the largest average accuracy calculated in the cross-validation. In the case of COAD, this model consists of a single isoform-pair model in gene FBLN2. (E) Significance of the isoform-pairs is assessed by comparing to the expected distributions of score S1 and IG values obtained from 1000 permutations of the class labels and by selecting at each permutation the highest score S1 and the highest IG. (F) The result from the permutation analysis is a ranking of significant isoform-pairs that change relative expression between tumor and normal samples more than expected by chance. (G) From this ranking of significant isoform-pairs, we detect as isoform switches those isoform-pairs with minimum score and expression value that anti-correlate across samples (Materials and Methods). In the example, CD44 presents a clear switch between two isoforms in COAD even though it was not chosen in the minimal classification model. (H) The isoform-pairs (either from the minimal classification model or from the set of isoform switches) are tested on a held-out data set of unpaired tumor samples.
Figure 2.
Figure 2.
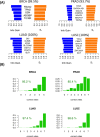
Predictive isoform-pair models. (A) Minimal isoform-pair classifiers for BRCA, PRAD, LUAD and LUSC (models for KICH, KIRC, HNSC and THCA are given in Supplementary Figure S2). Each panel shows the score S1 and IG for each isoform-pair in the model, which is indicated by the gene symbol. All isoform-pairs are significant according to the permutation analysis. Next to each cancer label the maximum expected accuracy is given, which is calculated from the cross-validation analysis. Plots with the expression values for each isoform pair are provided in Supplementary Figures S3–S8. (B) Blind tests of the isoform-pair models on the unpaired samples for each cancer type. The barplots indicate the proportion of samples (y-axis) for each possible number of isoform-pair rules from the model fulfilled by the tumor samples (x-axis). A sample is labeled according to a majority vote from all isoform-pair rules. The percentage of samples correctly labeled is also given.
Figure 3.
Figure 3.
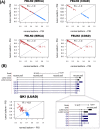
Examples of predictive isoform-pairs. (A) The relative inclusion values (PSIs) for the isoform-pair detected for FBLN2 separate tumor from normal samples in BRCA and COAD (upper panels). The x-axis represents the PSI for the isoform found to be more abundant in normal samples (normal isoform) and the y-axis represents the PSI of the most abundant isoform in tumor samples (tumor isoform). Tumor and normal samples are shown in red and blue, respectively. The bottom panels show the PSIs for the unpaired samples, and the percentage of correctly labeled tumor samples by this isoform-pair is indicated. (B) Significant isoform-pair change for QKI in LUAD. The gene locus of QKI is shown, indicating the exon-intron structures of the most abundant isoforms in tumor and normal samples. The zoom-in highlights the 3′-end region where the splicing variation takes place. The bottom left panel shows the PSI values for the normal (x-axis) and tumor isoforms (y-axis). As before, normal and tumor paired samples are shown in blue and red, respectively.
Figure 4.
Figure 4.
Isoform-pair rules for the basal-like breast tumors. (A) The top 7 recurrent isoform changes found comparing basal-like against a balanced pool of the other subtypes (luminal A, luminal B and Her2+). The barplot indicates the frequency of iterations for which the isoform-pair was significant according to the permutation analysis performed on the same subsampled sets. (B) Accuracy of the model for the classification of basal-like samples against other subtypes when tested on the entire set of 1036 BRCA tumor samples. The barplot shows the proportion of samples (y-axis) with each possible number of correct votes (x-axis), from 0 to the number of genes in the model, and the percentage of samples correctly classified.
Figure 5.
Figure 5.
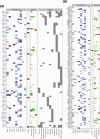
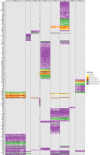
Catalog of isoform switches across various cancer types. Heatmap of the 244 isoform switches detected for the nine cancer types, separated according to whether the genes had an annotated Reactome pathway (A) or not (B). The heatmaps show whether the isoform switch occurs in each cancer type, with the color code indicating the IG of the switch: from light blue for low IG (0–0.2) to dark blue/purple for high IG (0.8–1). In red we indicate whether the gene with the switch is annotated as a tumor driver in COSMIC (http://cancer.sanger.ac.uk/). Regarding the mutations, we indicate the Jaccard index and the mutual-exclusion score with light green (0.01–0.02), medium green (0.02–0.03) and dark green (larger than 0.03). The presence of a significant difference (P-value < 0.05) of the relative inclusion (delta-PSI) between tumor and normal isoforms in mutated and non-mutated tumor samples before multiple-testing correction is indicated in brown color. The Reactome Pathway annotation for those genes for which this was available is also shown.
Figure 6.
Figure 6.
Protein affecting isoform switches across all tumor samples of the nine cancer types. Heatmap of the 244 isoform switches detected in the 9 cancer types, for all paired and unpaired tumor samples. The heatmap shows for each tumor sample whether the switches defined in that cancer type occur in that sample, and whether they affect the protein sequence: No CDS means no coding annotation was defined in either the normal or the tumor isoform; No normal CDS and No tumor CDS means no coding annotation was defined for the normal or the tumor isoform, respectively; No protein affected means that the amino-acid sequences are identical for both isoforms in the switch and only UTR regions are differing between the normal and tumor isoform; finally, Protein affected means the amino-acid sequence is different between the normal and tumor isoforms. The number in parenthesis on the legend shows the total number of isoform switches for that type. The label text ‘K’ in fourth column refers to the cancer type KICH.
Figure 7.
Figure 7.
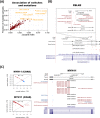
Association between somatic mutations and isoform switches. (A) Plot of the Jaccard index (x-axis) for the association of mutations with switches in tumor samples and the frequency of samples with mutations in the transcripts undergoing the switch (y-axis). (B) Example of the tumor suppressor FBLN2. Mutations present in each cancer type are represented in red if the switch is present in the same sample, and in blue if that sample does not have the switch. Each mutation is labeled with the identifier of the sample and the type of mutation. (C) Example of the oncogene MYH11. The relative inclusion values (PSI) of the two isoforms in the switch (left panels) separate tumor and normal in COAD and can classify correctly 91.5% of the unpaired tumor samples. Mutations present in each cancer type (right panel) are represented in red if the switch is present in the same sample, and in blue if that sample does not have the switch. Each mutation is labeled with the identifier of the sample and the type of mutation.

References

    1. TCGA. The Cancer Genome Atlas Network. Comprehensive molecular characterization of human colon and rectal cancer. Nature. 2012;487:330–337. - PMC - PubMed
    1. TCGA. The Cancer Genome Atlas Research Network. Comprehensive genomic characterization of squamous cell lung cancers. Nature. 2012;489:519–525. - PMC - PubMed
    1. TCGA. The Cancer Genome Atlas Network. Comprehensive molecular portraits of human breast tumours. Nature. 2012;490:61–70. - PMC - PubMed
    1. TCGA. The Cancer Genome Atlas Research Network. Comprehensive molecular characterization of clear cell renal cell carcinoma. Nature. 2013;499:43–49. - PMC - PubMed
    1. Bonomi S., Gallo S., Catillo M., Pignataro D., Biamonti G., Ghigna C. Oncogenic alternative splicing switches: role in cancer progression and prospects for therapy. Int. J. Cell Biol. 2013;2013:962038. - PMC - PubMed

Publication types

Associated data