Premature senescence in primary muscle cultures of myotonic dystrophy type 2 is not associated with p16 induction
- PMID: 25578974
- PMCID: PMC4289846
- DOI: 10.4081/ejh.2014.2444
Premature senescence in primary muscle cultures of myotonic dystrophy type 2 is not associated with p16 induction
Abstract
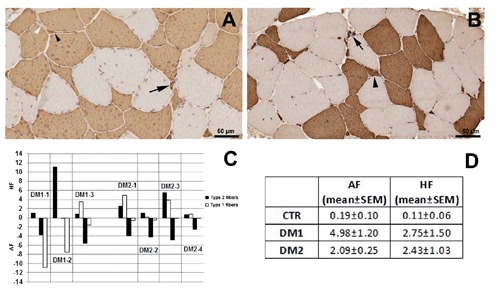
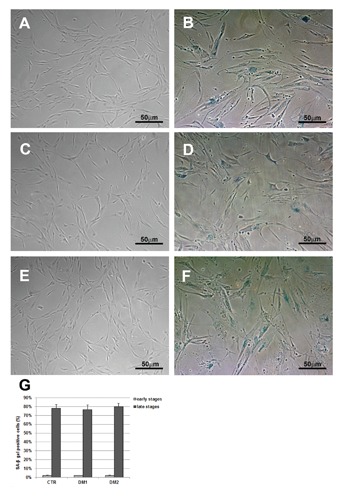
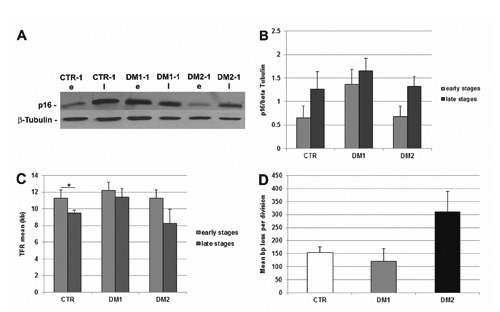
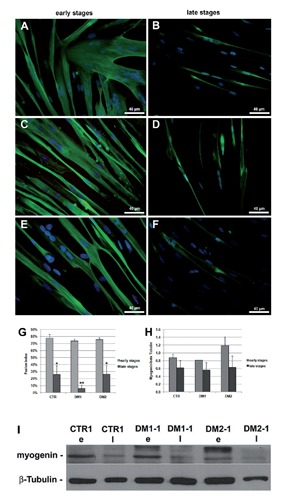
Myotonic dystrophy type 1 (DM1) and type 2 (DM2) are multisystemic disorders linked to two different genetic loci and characterized by several features including myotonia, muscle weakness and atrophy, cardiac dysfunctions, cataracts and insulin-resistance. In both forms, expanded nucleotide sequences cause the accumulation of mutant transcripts in the nucleus deregulating the activity of some RNAbinding proteins and providing an explanation for the multisystemic phenotype of DM patients. However this pathogenetic mechanism does not explain some histopathological features of DM skeletal muscle like muscle atrophy. It has been observed that DM muscle shares similarities with the ageing muscle, where the progressive muscle weakness and atrophy is accompanied by a lower regenerative capacity possibly due to the failure in satellite cells activation. The aim of our study is to investigate if DM2 satellite cell derived myoblasts exhibit a premature senescence as reported for DM1 and if alterations in their proliferation potential and differentiation capabilities might contribute to some of the histopathological features observed in DM2 muscles. Our results indicate that DM myoblasts have lower proliferative capability than control myoblasts and reach in vitro senescence earlier than controls. Differentely from DM1, the p16 pathway is not responsible for the premature growth arrest observed in DM2 myoblasts which stop dividing with telomeres shorter than controls. During in vitro senescence, a progressive decrease in fusion index is observable in both DM and control myotubes with no significant differences between groups. Moreover, myotubes obtained from senescent myoblasts appear to be smaller than those from young myoblasts. Taken together, our data indicate a possible role of DM2 premature myoblast senescence in skeletal muscle histopathological alterations i.e., dystrophic changes and type 2 fibre atrophy.
Conflict of interest statement
Conflicts of interest: the authors declare no conflicts of interest.
Figures


Similar articles
-
A role for PLCβ1 in myotonic dystrophies type 1 and 2.FASEB J. 2012 Jul;26(7):3042-8. doi: 10.1096/fj.11-200337. Epub 2012 Mar 29. FASEB J. 2012. PMID: 22459146
-
Large CTG repeats trigger p16-dependent premature senescence in myotonic dystrophy type 1 muscle precursor cells.Am J Pathol. 2009 Apr;174(4):1435-42. doi: 10.2353/ajpath.2009.080560. Epub 2009 Feb 26. Am J Pathol. 2009. PMID: 19246640 Free PMC article.
-
Muscle pathology in myotonic dystrophy: light and electron microscopic investigation in eighteen patients.Folia Morphol (Warsz). 2011 May;70(2):121-9. Folia Morphol (Warsz). 2011. PMID: 21630234
-
Skeletal muscle features in myotonic dystrophy and sarcopenia: do similar nuclear mechanisms lead to skeletal muscle wasting?Eur J Histochem. 2012 Aug 10;56(3):e36. doi: 10.4081/ejh.2012.e36. Eur J Histochem. 2012. PMID: 23027352 Free PMC article. Review.
-
Molecular mechanisms of muscle atrophy in myotonic dystrophies.Int J Biochem Cell Biol. 2013 Oct;45(10):2280-7. doi: 10.1016/j.biocel.2013.06.010. Epub 2013 Jun 21. Int J Biochem Cell Biol. 2013. PMID: 23796888 Free PMC article. Review.
Cited by
-
Muscle wasting in myotonic dystrophies: a model of premature aging.Front Aging Neurosci. 2015 Jul 9;7:125. doi: 10.3389/fnagi.2015.00125. eCollection 2015. Front Aging Neurosci. 2015. PMID: 26217220 Free PMC article. Review.
-
Myotonic Dystrophy-A Progeroid Disease?Front Neurol. 2018 Jul 25;9:601. doi: 10.3389/fneur.2018.00601. eCollection 2018. Front Neurol. 2018. PMID: 30140252 Free PMC article.
-
Skeletal muscle regeneration in facioscapulohumeral muscular dystrophy is correlated with pathological severity.Hum Mol Genet. 2020 Sep 29;29(16):2746-2760. doi: 10.1093/hmg/ddaa164. Hum Mol Genet. 2020. PMID: 32744322 Free PMC article.
-
Abnormalities in Skeletal Muscle Myogenesis, Growth, and Regeneration in Myotonic Dystrophy.Front Neurol. 2018 May 28;9:368. doi: 10.3389/fneur.2018.00368. eCollection 2018. Front Neurol. 2018. PMID: 29892259 Free PMC article. Review.
-
Myotonic dystrophy type 2 and modifier genes: an update on clinical and pathomolecular aspects.Neurol Sci. 2017 Apr;38(4):535-546. doi: 10.1007/s10072-016-2805-5. Epub 2017 Jan 11. Neurol Sci. 2017. PMID: 28078562 Review.
References
-
- Harper PS. Myotonic dystrophy, 3th ed.Sanders, London, UK, 2001.
-
- Brook JD, McCurrach ME, Harley HG, Buckler AJ, Church D, Aburatani H, et al. Molecular basis of myotonic dystrophy: expansion of a trinucleotide (CTG) repeat at the 3’ end of a transcipt encoding a protein kinase family member. Cell 1992;68:799-808. - PubMed
-
- Fu YH, Pizzuti A, Fenwick RG, Jr, King J, Rajnarayan S, Dunne PW, et al. An unstable triplet repeat in a gene related to myotonic muscular dystrophy. Science 1992;255:1256-8. - PubMed
-
- Mahadevan M, Tsilfidis C, Sabourin L, Shutler G, Amemiya C, Jansen G, et al. Myotonic dystrophy mutation: an unstable CTG repeat in the 3’ untranslated region of the gene. Science 1992;255:1253-5. - PubMed
-
- Liquori CL, Ricker K, Moseley ML, Jacobsen JF, Kress W, Naylor SL, et al. Myotonic dystrophy type 2 caused by a CCTG expansion in intron 1 of ZNF9. Science 2001;293:864-7. - PubMed
Publication types
MeSH terms
Substances
LinkOut - more resources
Full Text Sources
Other Literature Sources