Review
. 2014 Dec 12;58(4):2461.
doi: 10.4081/ejh.2014.2461.

Autofluorescence spectroscopy and imaging: a tool for biomedical research and diagnosis

Affiliations
Review

Autofluorescence spectroscopy and imaging: a tool for biomedical research and diagnosis

A C Croce et al. Eur J Histochem. .

Abstract

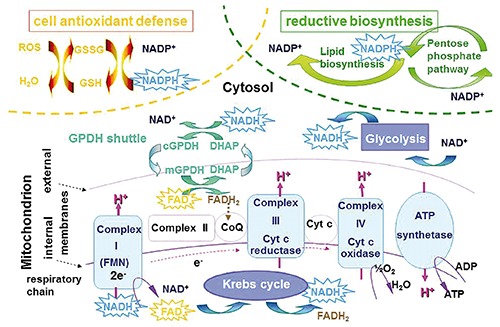
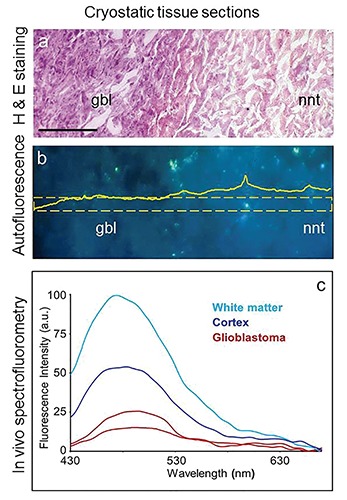
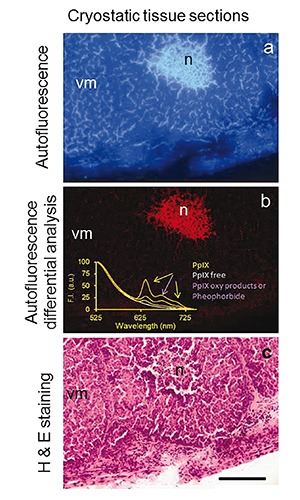
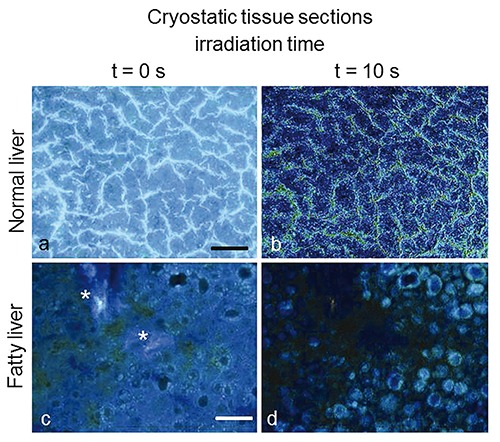
Native fluorescence, or autofluorescence (AF), consists in the emission of light in the UV-visible, near-IR spectral range when biological substrates are excited with light at suitable wavelength. This is a well-known phenomenon, and the strict relationship of many endogenous fluorophores with morphofunctional properties of the living systems, influencing their AF emission features, offers an extremely powerful resource for directly monitoring the biological substrate condition. Starting from the last century, the technological progresses in microscopy and spectrofluorometry were convoying attention of the scientific community to this phenomenon. In the future, the interest in the autofluorescence will certainly continue. Current instrumentation and analytical procedures will likely be overcome by the unceasing progress in new devices for AF detection and data interpretation, while a progress is expected in the search and characterization of endogenous fluorophores and their roles as intrinsic biomarkers.


Conflict of interest statement

Conflict of interests: the authors declare no conflicts of interest.

Figures

Figure 1.
Figure 1.
Examples of autofluorescence distribution patterns recorded from cultured, living pig cells. The emission signal rising from the cytoplasm around darker nuclei is mainly ascribable to NAD(P)H, the contribution of globular proteins being almost negligible under the conditions used for detection (exc 366 nm; em 420-600 nm). The signal is more diffusely distributed in stem cells (a) than in a mature one (b), where structures ascribable to the typical morphology of mitochondria can be easily recognized. These findings are consistent with a prevalent engagement in anaerobic energetic metabolism in stem cells, and in aerobic – mitochondrial – one in the mature one. Intracytoplasmic brightly fluorescing granules (c,d) are ascribable to lipofuscins, accumulated as undigested material from autophagic processes contributing to the maintenance of the stemness homeostasis or in cell eldering. Scale bar. 20 μm.
Figure 2.
Figure 2.
Typical spectral profiles of autofluorescence emission from single endogenous fluorophores. Spectra were recorded by microspectrofluorometry from pure compounds in solution, except for the fibrous proteins collagen and elastin and lipopigments, recorded respectively from connective tissue of hepatic portal selected areas of a liver cryostatic tissue section, or from remnant material collected after organic extraction of liver tissue homogenates. Spectra were normalized to the maximum emission peak for presentation, except for the broad emission of lipopigments. Excitation light: 366 nm.
Figure 3.
Figure 3.
Unfixed cryostatic tissue sections from human colon, non-neoplastic mucosa (a) and adenocarcinoma at different staging (b,c), after Hematoxylin and Eosin staining. Non-neoplastic tissue (a) shows the layer organization: mucosa (m) at the inner surface, muscolaris mucosa (mm), submucosa (sm) with blood vessels and muscolaris esterna (me). The histological organization of non-neoplastic mucosa is subversed by the rising of the neoplasia. The highly fluorescing connective tissue in submucosa (d, and AF signal plot profile inside) is strongly affected, only some remnants being appreciable in the neoplastic mass (e). Excitation: 366 nm, emission: 420-640 nm. Scale bars: a-c), 650 µm; d), 100 µm; e), 170 µm.
Figure 4.
Figure 4.
Example of fitting analysis of an autofluorescence spectrum collected via fiber optic probe from a rat liver under living conditions. Real measured spectrum and calculated curve as the sum of the endogenous fluorophore contributions are shown, along with spectral functions representing each endogenous fluorophore. Before analysis, spectra are normalized to 100% at the peak maximum. Curve-fitting procedure is then performed to evaluate the relative contributions of each fluorophore to the overall emission. The procedure consists in an iterative non-linear analysis, based on the Marquardt–Levenberg algorithm through the finding of the true absolute minimum value of the sum of squared deviations of a combination of GMG (half-Gaussian Modified Gaussian) spectral functions, each of them representing the emission profile of a pure fluorophore. The goodness of fitting is verified trough the residual analysis and r coefficient of determination, ≥0.898 in this case. Fitting parameters are reported as peak center wavelength (λ) / full width at half intensity maximum (FWHM): NAD(P)H free, 463 nm / 115 nm; NAD(P)H bound, 444 nm / 105 nm; vitamin A, 488 nm /102 nm; fatty acids, 470 nm / 90 nm; flavins, 526 nm / 81 nm. Due to parameter variability because of heterogeneity in composition and fluorescing properties, the functions of lipopigments and proteins are left free to adjust, respectively in the 530-600 nm range, and at λ <440 nm, to reach the goodness of fitting analysis results. Excitation: 366 nm.
Figure 5.
Figure 5.
Simplified scheme of the main metabolic pathways affecting the redox state of NAD(P)H and flavins, the coenzymes participating to the reactions as reductive equivalent donor /acceptors. The star frames indicate the fluorescing reduced form of NAD(P)H and oxidized form of flavins.
Figure 6.
Figure 6.
Unfixed cryostatic brain tissue sections from a glioblastoma bearing patient. a) Hematoxylin and Eosin staining evidences an altered stainability and cell density in neoplastic (glioblastoma, gbl) tissue as compared to the surrounding non-neoplastic tissue (nnt). b) Autofluorescence imaging of a serial, unstained tissue section, shows a lower emission signal in neoplastic as compared to the non-neoplastic area; a quantitative representation of this difference is given by the amplitude distribution profile of the selected area indicated by the frame overimposed to the picture. Excitation: 366 nm; emission: 420-640 nm; scale bars: 200 µm. c) Spectrofluorometry performed in vivo, via fiber optic probe during surgical operation showed an even more marked lower autofluorescence amplitude, and spectral profile changes in neoplastic tissue in comparison with the non-neoplastic tissues (white matter and cortex); spectra are shown as real values.
Figure 7.
Figure 7.
Unfixed cryostatic tissue section from a mouse mammary tumor. Autofluorescence image collected at t = 0 s of excitation-light irradiation from (a), and the distribution pattern of the signal lost (b), detected through the differential analysis of images recorded from the same tissue area at t = 0 s and t= 10 s of continuous irradiation; excitation: 330-385 nm; emission <420 nm. The lost signal representing the most photolabile fluorescing species occurring in this tissue is ascribable to porphyrins. The presence of PpIX, in particular, is confirmed by the spectra recorded under 405 nm excitation from the same tissue area, showing its typical emission bands centered at ≈ 630 nm and 700 nm. The band at about 670 nm is ascribable to pheophorbide or porphyrin oxidative products. The PpIX band amplitude is consistent with the low diffused signal in the vital mass and the much higher emission in necrosis, identified when the measured area has been retrieved after conventional Hematoxylin and Eosin staining (c), for a direct comparison with autofluorescence distribution in tumor living cell mass (vm) and necrosis (n). Scale bar: 100 µm.
Figure 8.
Figure 8.
Normal (a,b) and fatty (c,d) liver from rat models. Autofluorescence images collected at t = 0 s of excitation light irradiation from unfixed, unstained cryostatic tissue sections (a,c), and topographical distribution of the whole signal lost (b,d), obtained through the differential analysis of images recorded from the same tissue area at t = 0 s and t= 10 s of continuous irradiation. In the normal liver a signal loss occurs mainly along sinusoids, likely involving vitamin A accumulated in Ito cells. Fatty liver shows marked signal decrease within vesicular structures likely corresponding to lipid droplets, while the bright light blue fluorescing connective component (*) observed at t = 0 s of irradiation undergoes a much lesser decrease. Image levels are adjusted to optimize image observation. Excitation: 366 nm. Scale bars: a), 80 µm; c), 100 µm.
Figure 9.
Figure 9.
Autofluorescence emission spectra recorded at t = 0 and at t = 10 s of irradiation from unfixed, unstained cryostatic sections of rat livers: connective tissue of a portal area (a) and lipofuscin granules (b) from a normal liver parenchima, and lipid droplet (c) from a fatty liver. The changes induced in the whole emission profile by light irradiation are evidenced by the measured spectra normalized to the peak maximum. The response to irradiation in terms of spectral shape and amplitude changes in the AF emission from collagen, lipofuscin-like lipopigments and vitamin A/fluorescing lipids is represented by the curves of each single fluorophore spectral function. Excitation: 366 nm.

Similar articles

Cited by

References

    1. Udenfriend S. Fluorescence Assay in Biology and Medicine. Vol II London: Academic Press; 1969.
    1. Kasten FH. The origins of modern fluorescence microscopy and fluorescence probes, p. 4-47 In: Kohen E., Hirschberg J.G. JG (eds.), Cell structure and function by microspectrofluorometry. Academic Press Inc., 1989.
    1. Balaban RS, Mandel LJ. Optical methods for the study of metabolism in intact cells, p. 213-36 In: Forskett J.K., Grinstein S. (eds.), Non-invasive techniques in cell biology. Wiley Liss, 1990.
    1. Rost FWD. Fluorescence microscopy, vol 2 Cambridge University Press, 1995.
    1. Wagnières GA, Star WM, Wilson BC. In vivo fluorescence spectroscopy and imaging for oncological applications. Photochem Photobiol 1998;68:603-32. - PubMed

Publication types

MeSH terms