. 2015 Mar;185(3):808-19.
doi: 10.1016/j.ajpath.2014.11.019. Epub 2015 Jan 8.

Lipolysis of visceral adipocyte triglyceride by pancreatic lipases converts mild acute pancreatitis to severe pancreatitis independent of necrosis and inflammation

Affiliations

Lipolysis of visceral adipocyte triglyceride by pancreatic lipases converts mild acute pancreatitis to severe pancreatitis independent of necrosis and inflammation

Krutika Patel et al. Am J Pathol. 2015 Mar.

Abstract

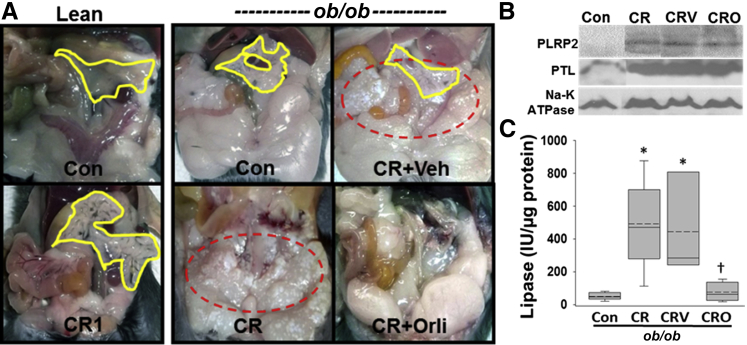
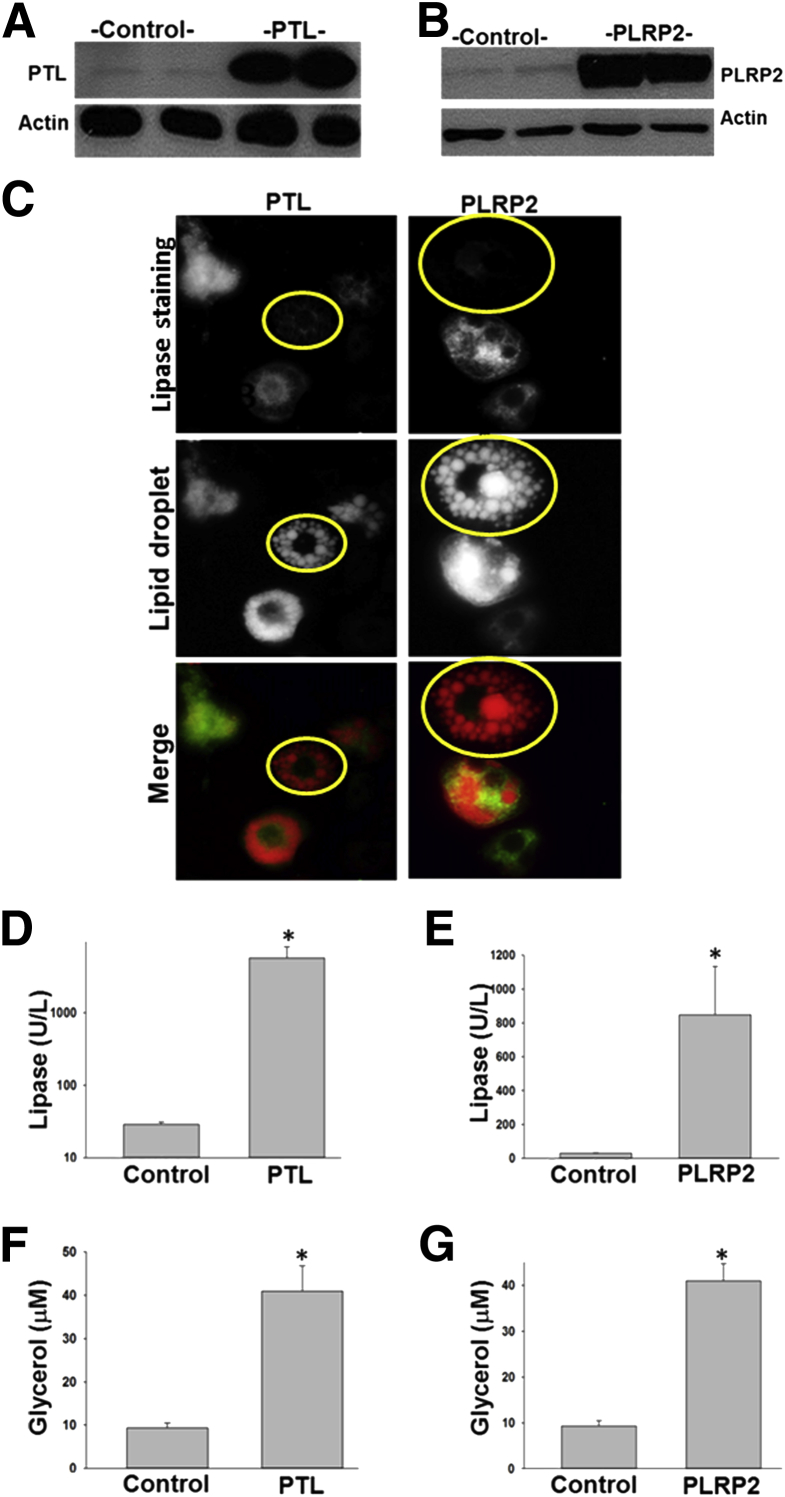
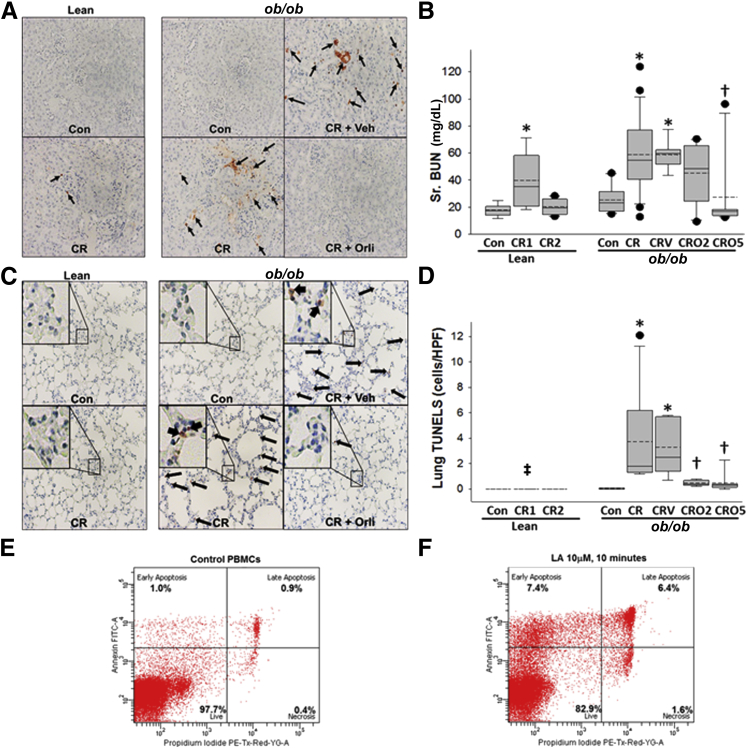
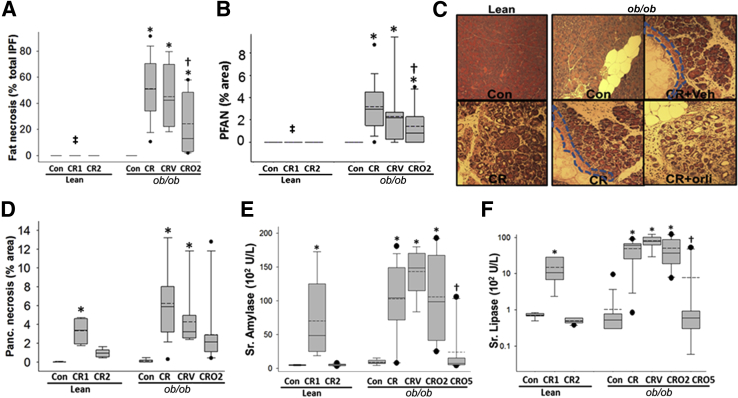
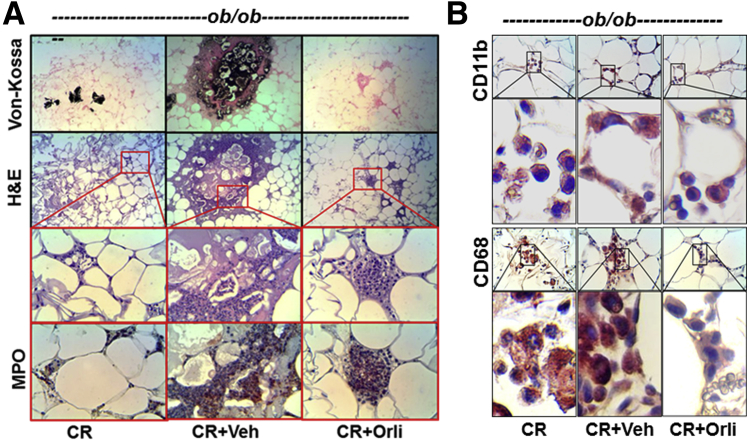
Visceral fat necrosis has been associated with severe acute pancreatitis (SAP) for over 100 years; however, its pathogenesis and role in SAP outcomes are poorly understood. Based on recent work suggesting that pancreatic fat lipolysis plays an important role in SAP, we evaluated the role of pancreatic lipases in SAP-associated visceral fat necrosis, the inflammatory response, local injury, and outcomes of acute pancreatitis (AP). For this, cerulein pancreatitis was induced in lean and obese mice, alone or with the lipase inhibitor orlistat and parameters of AP induction (serum amylase and lipase), fat necrosis, pancreatic necrosis, and multisystem organ failure, and inflammatory response were assessed. Pancreatic lipases were measured in fat necrosis and were overexpressed in 3T3-L1 cells. We noted obesity to convert mild cerulein AP to SAP with greater cytokines, unsaturated fatty acids (UFAs), and multisystem organ failure, and 100% mortality without affecting AP induction or pancreatic necrosis. Increased pancreatic lipase amounts and activity were noted in the extensive visceral fat necrosis of dying obese mice. Lipase inhibition reduced fat necrosis, UFAs, organ failure, and mortality but not the parameters of AP induction. Pancreatic lipase expression increased lipolysis in 3T3-L1 cells. We conclude that UFAs generated via lipolysis of visceral fat by pancreatic lipases convert mild AP to SAP independent of pancreatic necrosis and the inflammatory response.


Figures

Figure 1
Figure 1
Pancreatic lipase–dependent release of UFAs from visceral fat necrosis causes CR pancreatitis to be lethal in ob/ob mice. Bar graphs of lean (C57bl6) and ob/ob mice showing body weight (A), percentage composition (lean and fat) (B), and percentage triglyceride (TG) composition of gonadal fat pads (C). ob/ob Mice with cerulein (CR) acute pancreatitis (AP) have elevated nonesterified fatty acids (NEFAs) (D) and unsaturated fatty acids (UFAs) (E), but not saturated fatty acids (SFAs) (G), versus obese control (Con) or lean mice with CR AP for 1 or 2 days (CR1 and CR2, respectively). UFA levels are reduced at day 2 (CRO2) and day 5 (CRO5) in ob/ob mice, and hypocalcemia is prevented (H), with orlistat use. Box plots show the means (dashed lines), medians (solid lines), 25th and 75th percentiles (boxes), and 10th and 90th percentiles (brackets). F: Kaplan-Meyer 5-day survival curve showing 100% mortality in ob/ob mice with CR with or without vehicle (CR and CRV, respectively) by day 3, which is improved to 80% survival (2/10 mortality) with orlistat treatment. n ≥ 8 in each group. P < 0.05 versus controls in the respective lean and ob/ob mice; P < 0.05 versus ob/ob CR; P < 0.05 for lean CR1 versus ob/ob CR. Sr., serum.
Figure 2
Figure 2
Fat necrosis is mediated by active pancreatic lipases. A: Gross appearance of the peritoneal cavities in ob/ob mice show chalky white dotted areas of saponification (dashed red outlines) in the visceral fat pads of mice with pancreatitis ± vehicle [cerulein (CR); CR + Veh]. Fat necrosis is undetectable in lean or orlistat-treated mice with pancreatitis (CR1 and CR + Orli, respectively) despite all pancreatitis groups having pancreatic edema (yellow lines). B: Western blots of the gonadal fat pads show increased, pancreatic lipase–related protein-2 (PLRP2) and pancreatic triglyceride lipase (PTL) in ob/ob mice with pancreatitis sacrificed at day 2 [CR, CR vehicle (CRV)], irrespective of orlistat treatment (CRO), which apparently reduces the activity of pancreatic lipase in these mice (C). Box plots show the means (dashed lines), medians (solid lines), 25th and 75th percentiles (boxes), and 10th and 90th percentiles (brackets). n ≥ 6 in each group. P < 0.05 versus controls; P < 0.05 versus ob/ob CR. Con, control.
Figure 3
Figure 3
Pancreatic lipases increase lipolysis in adipocytes. Adenoviral expression of pancreatic triglyceride lipase (PTL) and pancreatic lipase–related protein-2 (PLRP2) in 3T3-L1 increases their protein expression on Western blot analysis (A and B) associated with an increase in lipase activity (D and E) and glycerol release into the medium (F and G). C: Although control cells (yellow outlines), which do not express PTL or PLRP2, exhibit several discreet lipid droplets in all the images, the expression of PTL or PLRP2 causes a loss of this lipid-droplet morphology and an increase in lipid staining in the cytoplasm. n ≥ 4 in each group. *P < 0.05 versus controls. Original magnification, ×60 (C).
Figure 4
Figure 4
Lipase inhibition prevents MSOF. Representative images show that terminal deoxynucleotidyl transferase dUTP nick end labeling–positive cells (arrows) increase in the kidney tubules of ob/ob mice with cerulein (CR) acute pancreatitis (AP) ± vehicle (Veh) (A), and serum (Sr.) blood urea nitrogen (BUN) (mg/dL) increases transiently in lean mice on day 1 and in ob/ob CR ± vehicle (CRV) mice at the time of mortality, which normalizes by day 5 of orlistat treatment (B). C and D: Concentrations of terminal deoxynucleotidyl transferase dUTP nick end labeling–positive cells in the lungs of ob/ob mice with CR AP (arrows) are reduced with orlistat use. Insets in C show the boxed area at higher magnification (×100). Box plots show the means (dashed lines), medians (solid lines), 25th and 75th percentiles (boxes), and 10th and 90th percentiles (brackets). The assessment of peripheral blood mononuclear cell (PBMC) apoptosis, indicated by annexin V staining (and necrosis by increased propidium iodide staining), show increased early and late apoptosis induced by 10 μmol/L linoleic acid (LA) within 10 minutes of exposure (F) compared with control PBMC (E). n ≥ 8 in each group. P < 0.05 versus controls (Con) in the respective lean and ob/ob mice; P < 0.05 versus ob/ob CR; P < 0.05 for lean CR for 1 day versus ob/ob CR. Original magnification, ×10 (A and C). CR1, lean mice sacrificed at the end of day 1; CR2, lean mice sacrificed at the end of day 2; CRO2, mice given orlistat and sacrificed at the end of 2 days; CRO5, mice given orlistat and sacrificed at the end of 5 days; FITC-A, fluorescein isothiocyanate A; HPF, high-power field; PE-Tx-Red-YG-A, phytoerythrin-texas red-yellow green-A; Sr., serum.
Figure 5
Figure 5
Lipase inhibition reduces pancreatic fat necrosis and perifat acinar necrosis but not pancreatic necrosis. The quantification and images of fat necrosis [amorphous deposits in necrotic intrapancreatic fat (IPF), in the ob/ob cerulein (CR) ± vehicle (V) group] (A) and perifat acinar necrosis (PFAN) (B). PFAN (dashed lines) is absent in lean mice and is reduced with orlistat (orli) use in ob/ob mice with AP (C). D: Pancreatic (Panc.) acinar necrosis is similar in all groups with AP. Serum amylase (E) and lipase (F) are increased similarly in lean mice on day 1 and in ob/ob mice irrespective of orlistat treatment on day 2 or at mortality. These concentrations are normalized by day 5 in surviving mice. P < 0.05 versus controls in the respective lean and ob/ob mice; P < 0.05 versus ob/ob CR; P < 0.05 for lean CR for 1 day versus ob/ob CR. Box plots show the means (dashed lines), medians (solid lines), 25th and 75th percentiles (boxes), and 10th and 90th percentiles (brackets). n ≥ 8 in each group. Original magnification, ×4 (C). CR1, lean mice sacrificed at the end of day 1; CR2, lean mice sacrificed at the end of day 2; CRO2, mice given orlistat and sacrificed at the end of 2 days; CRO5, mice given orlistat and sacrificed at the end of 5 days; Veh, vehicle.
Figure 6
Figure 6
Serum cytokine concentrations are greater in ob/ob mice and unaffected by lipase inhibition early in the disease. Box plots depicting serum IL-6 (A), monocyte chemoattractant protein 1 (MCP-1) (B), resistin (C), and tumor necrosis factor (TNF)-α (D) being significantly higher in ob/ob mice versus lean mice. These concentrations are unaffected with orlistat treatment on day 2 and are reduced by day 5. P < 0.05 versus controls in the respective lean and ob/ob mice; P < 0.05 versus ob/ob cerulein (CR); P < 0.05 for the lean CR for 1 day versus ob/ob CR. Box plots show the means (dashed lines), medians (solid lines), 25th and 75th percentiles (boxes), and 10th and 90th percentiles (brackets). n ≥ 8 in each group. CR1, lean mice sacrificed at the end of day 1; CR2, lean mice sacrificed at the end of day 2; CRO2, mice given orlistat and sacrificed at the end of 2 days; CRO5, mice given orlistat and sacrificed at the end of 5 days; Veh, vehicle.
Figure 7
Figure 7
Acute inflammatory cell infiltration of fat in ob/ob mice with AP is unaffected by lipase inhibition. A: Serial sections of ob/ob gonadal fat pads show fat necrosis as brown–black staining (Von-Kossa) and amorphous blue appearance (hematoxylin and eosin) corresponding to saponified fatty acids, which are reduced with orlistat (Orli) use. However, serial sections of inflammatory cell infiltrates (insets), positive for myeloperoxidase (MPO), are unaffected with orlistat use. B: Images and magnifications of immunohistochemistry analysis of CD11b-positive cells show these to be unaffected by lipase inhibition, whereas CD68 positivity is reduced in the orlistat-treated group (cerulein [CR] + Orli). Boxed areas shown at higher magnification below. Original magnification: ×10 (top two rows, A); ×40 (bottom two rows, A; first and third rows, B); ×100 (second and fourth rows, B).

References

    1. Fitz R.H. Acute pancreatitis: a consideration of pancreatic hemorrhage, hemorrhagic, suppurative, and gangrenous pancreatitis, and of disseminated fat-necrosis. Boston Med Surg J. 1889;120:181–187.
    1. Hotchkiss L.W. VIII. Acute Pancreatitis with Very Extensive Fat Necrosis. Ann Surg. 1912;56:111–117. - PMC - PubMed
    1. Pinnick K.E., Collins S.C., Londos C., Gauguier D., Clark A., Fielding B.A. Pancreatic ectopic fat is characterized by adipocyte infiltration and altered lipid composition. Obesity (Silver Spring) 2008;16:522–530. - PubMed
    1. Saisho Y., Butler A.E., Meier J.J., Monchamp T., Allen-Auerbach M., Rizza R.A., Butler P.C. Pancreas volumes in humans from birth to age one hundred taking into account sex, obesity, and presence of type-2 diabetes. Clin Anat. 2007;20:933–942. - PMC - PubMed
    1. Bakker O.J., van Santvoort H., Besselink M.G., Boermeester M.A., van Eijck C., Dejong K., van Goor H., Hofker S., Ahmed Ali U., Gooszen H.G., Bollen T.L., Dutch Pancreatitis Study Group Extrapancreatic necrosis without pancreatic parenchymal necrosis: a separate entity in necrotising pancreatitis? Gut. 2013;62:1475–1480. - PubMed

Publication types

MeSH terms