. 2015 Feb;22(2):124-31.
doi: 10.1038/nsmb.2941. Epub 2015 Jan 12.

The energy landscape of adenylate kinase during catalysis

Affiliations

The energy landscape of adenylate kinase during catalysis

S Jordan Kerns et al. Nat Struct Mol Biol. 2015 Feb.

Abstract

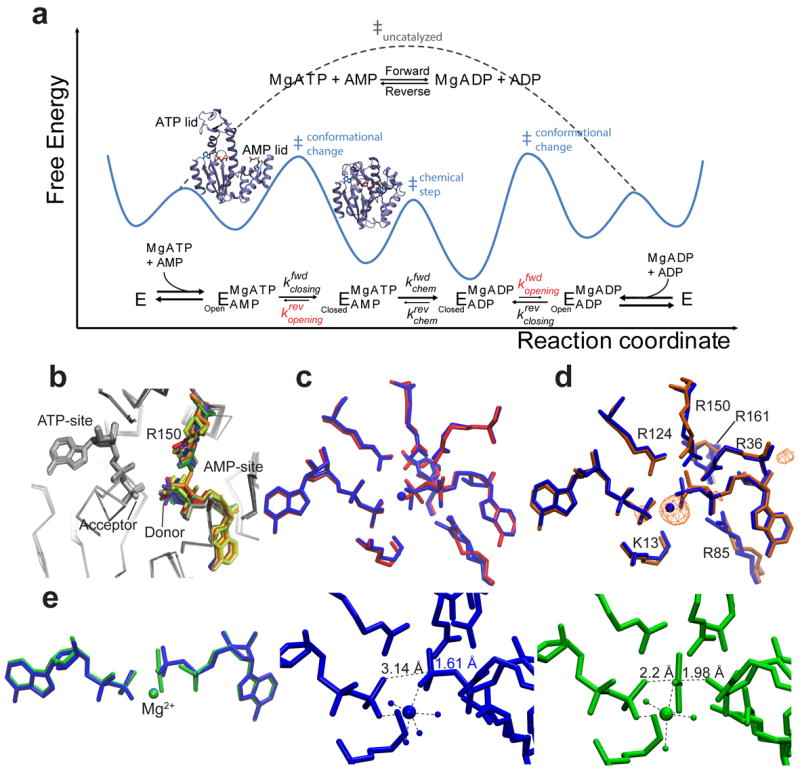
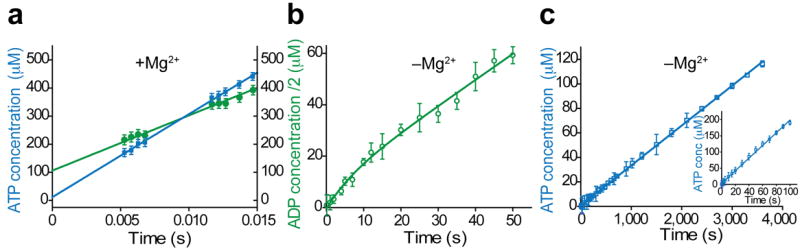
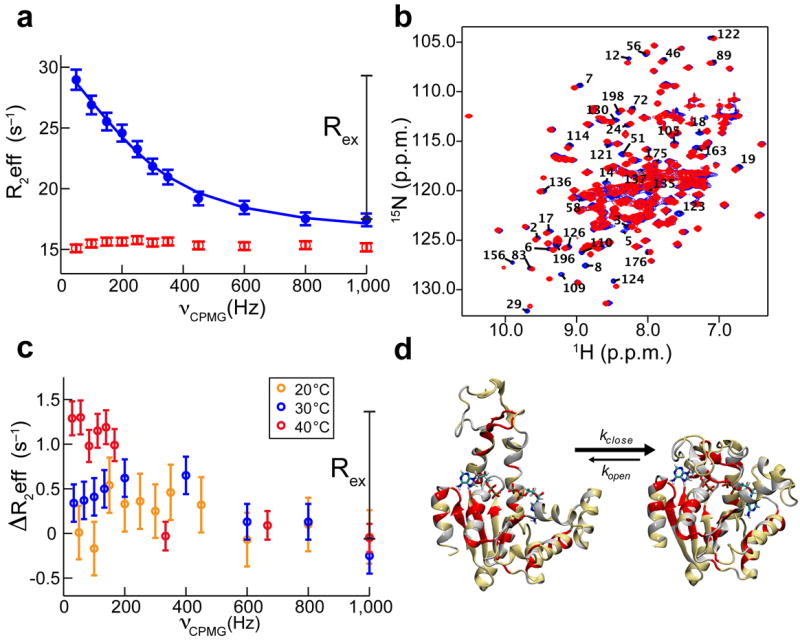
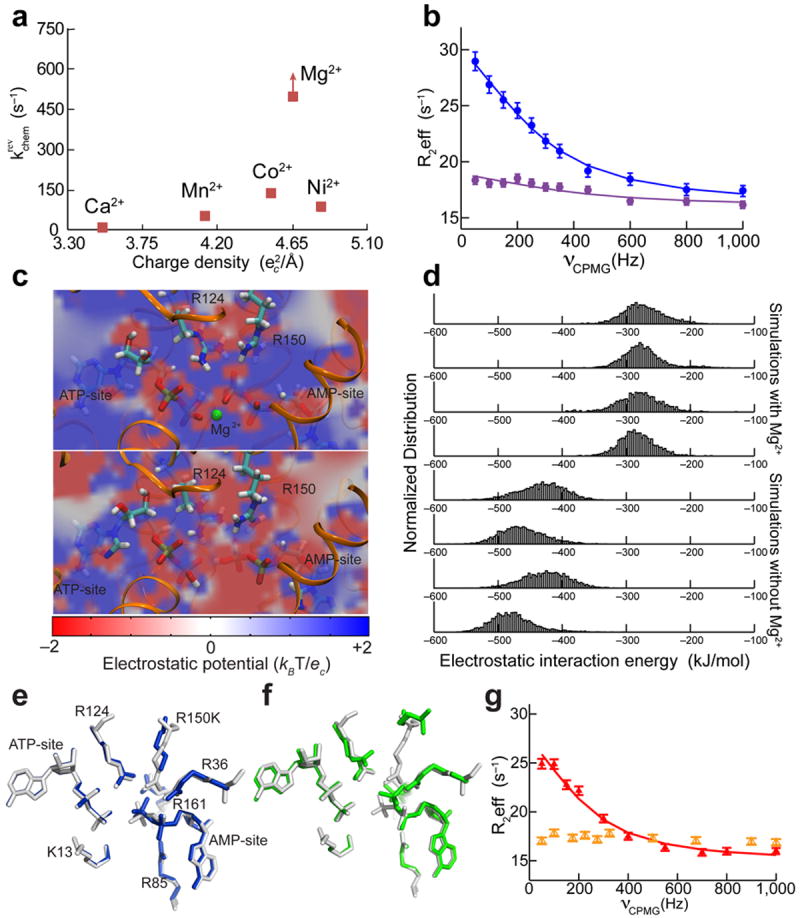
Kinases perform phosphoryl-transfer reactions in milliseconds; without enzymes, these reactions would take about 8,000 years under physiological conditions. Despite extensive studies, a comprehensive understanding of kinase energy landscapes, including both chemical and conformational steps, is lacking. Here we scrutinize the microscopic steps in the catalytic cycle of adenylate kinase, through a combination of NMR measurements during catalysis, pre-steady-state kinetics, molecular-dynamics simulations and crystallography of active complexes. We find that the Mg(2+) cofactor activates two distinct molecular events: phosphoryl transfer (>10(5)-fold) and lid opening (10(3)-fold). In contrast, mutation of an essential active site arginine decelerates phosphoryl transfer 10(3)-fold without substantially affecting lid opening. Our results highlight the importance of the entire energy landscape in catalysis and suggest that adenylate kinases have evolved to activate key processes simultaneously by precise placement of a single, charged and very abundant cofactor in a preorganized active site.


Figures

Figure 1
Figure 1. Adk free-energy landscape of catalysis and exploration of the phosphoryl-transfer step by X-ray crystallography
(a) Overall Adk reaction, minimal reaction scheme, and corresponding schematic of the catalytic energy landscape based on the measured enzyme kinetics (Table 2). Rate-limiting lid-opening (kopening) is shown in red and visualized by the open and closed structures. (b) The superposition of AAdk structures with ADPs bound. Conformational heterogeneity of the donor phosphate group and R150 are highlighted in color. (c) Superposition of AAdk structures with bound ADPs in the presence (PDB 4CF7, blue) and absence (PDB 4JL5, red) of Mg2+. (d) Superposition of AAdk complexed with Mg2+–ADP–ADP (blue) and Co2+–ADP–ADP (PDB 4JKY, orange). The anomalous scattering of the electron density at the Co-edge (λ=1.609 Å) is shown as anomalous difference map contoured at 5.5 σ (orange). (e) Superposition of Mg2+–ADP–AMP–AlF4 (PDB 3SR0, green) with Mg2+–ADP–ADP (blue). Detailed structures of the active site of both the substrate–enzyme complex (blue) and transition-state analogue (green) showing metal coordination and relevant O–P or O–Al distances (dashed lines) and the covalent O–P bond (blue).
Figure 2
Figure 2. Role of active-site dynamics in efficient phosphoryl transfer versus unproductive hydrolysis
(a,b)Superposition of representative snapshots of 200 ns MD simulations of the ADP–ADP ternary complex of AAdk (a) with (yellow) and (b) without Mg2+. (c) Unproductive ATP hydrolysis by 100 μM of EAdk. Fit of the time dependence of nucleotide concentrations yielded a hydrolysis rate of ~2°10–6 s–1. (d) Overlay of the active site of the crystal structure of AAdk bound to Mg2+–ADP–AMP–AlF4 (green) including bound water molecules (green spheres) and a typical snapshot from a 200 ns MD simulation of the AAdk–Mg2+–ADP–ADP complex (yellow). The transparent yellow spheres represent the isosurface of value 0.75 for the fractional occupancy of the water oxygen atoms during the MD simulation. A cavity excluded from access to bulk solvent (transparent green) is solvated by a number of water molecules.
Figure 3
Figure 3. Catalytic effect of the Mg2+ cofactor
Pre-steady-state kinetics of EAdk at 25 °C measured by quench-flow (a) with and (b,c) without Mg2+ (n = 3 experiments; mean ± s.e.m.). (a) 113 μM EAdk, 4 mM ATP, 4 mM AMP and 8 mM MgCl2 in the forward direction (green) and 4 mM ADP and MgCl2 in the reverse direction (blue) were used. (b) A resolved burst phase is seen in the forward direction with 20 μM EAdk and 4 mM ATP and AMP, providing the rates of both the P-transfer and lid-opening, while in the reverse reaction (c) No burst phase is seen with 20 μM or 500 μM EAdk (inset) and 4 mM ADP.
Figure 4
Figure 4. EAdk structure and dynamics during catalysis with and without Mg2+ studied by NMR
(a) 15N-TROSY CPMG relaxation dispersion NMR experiments at 25 °C on WT EAdk saturated with 20 mM nucleotides. Representative dispersion profile for residues sensitive to lid-opening/closing in the presence of Mg2+ (blue) are fully suppressed in its absence (red). (b) Overlay of [H-15N]-TROSY-HSQC spectra of WT EAdk during turnover with (blue) and without (red) Mg2+. (c) Temperature dependence of normalized 15N-TROSY CPMG relaxation dispersion profiles of WT EAdk. (d) Residues with dispersion curves at 40 °C without Mg2+ are plotted on the EAdk–ADP–ADP open and closed structures (red); residues with no data due to overlap or missing signals are shown in grey and nucleotides are shown in stick representation. Uncertainties (s.d.) in R2eff (a,c) were estimated from the variance for a number of non-exchanging peaks (n = 7).
Figure 5
Figure 5. The nature of the divalent cation drastically affects phosphoryl transfer but not Adk conformational dynamics
(a) The P-transfer step of EAdk in the reverse reaction measured as a function of different divalent metals. The rate constant shown for Mg2+ is a lower limit. (b) 15N-TROSY CPMG relaxation dispersion profiles of EAdk with Mg2+ (blue) or Ca2+ (purple). (c) Active-site electrostatic potential computed from representative structures extracted from the MD simulations with (top) or without (bottom) Mg2+, plotted on a plane cutting through the active site. (d) The distribution of the electrostatic interaction energy between the ADP molecules and R124 and R150 is plotted for four MD simulations with and without Mg2+. The histograms show the electrostatic interaction energies computed for configurations evenly distributed in time along the trajectories. (e,f) The two molecules in the asymmetric unit of AAdk R150K with ADP bound (blue and green) are superimposed with WT AAdk (gray). (g) 15N-TROSY CPMG relaxation dispersion at 25 °C on the EAdk R150K mutant saturated with 20 mM nucleotides. Dispersion curves for residues sensitive to lid-opening/closing in the presence of Mg2+ (red) are fully suppressed in the absence of Mg2+ (orange). Uncertainties (s.d.) in R2eff (b,g) were estimated from the variance for a number of non-exchanging peaks (n = 7).

Comment in

References

    1. Westheimer FH. Why nature chose phosphates. Science. 1987;235:1173–1178. - PubMed
    1. Bowler MW, Cliff MJ, Waltho JP, Blackburn GM. Why did Nature select phosphate for its dominant roles in biology? New Journal of Chemistry. 2010;34:784–794.
    1. Schroeder GK, Lad C, Wyman P, Williams NH, Wolfenden R. The time required for water attack at the phosphorus atom of simple phosphodiesters and of DNA. Proceedings of the National Academy of Sciences of the United States of America. 2006;103:4052–4055. - PMC - PubMed
    1. Kamerlin SC, Sharma PK, Prasad RB, Warshel A. Why nature really chose phosphate. Q Rev Biophys. 2013;46:1–132. - PMC - PubMed
    1. Lassila JK, Zalatan JG, Herschlag D. Biological phosphoryl-transfer reactions: understanding mechanism and catalysis. Annu Rev Biochem. 2011;80:669–702. - PMC - PubMed

Publication types

Substances