. 2015 May;61(5):1627-42.
doi: 10.1002/hep.27687. Epub 2015 Mar 20.

IL-33 facilitates oncogene-induced cholangiocarcinoma in mice by an interleukin-6-sensitive mechanism

Affiliations

IL-33 facilitates oncogene-induced cholangiocarcinoma in mice by an interleukin-6-sensitive mechanism

Daisaku Yamada et al. Hepatology. 2015 May.

Abstract

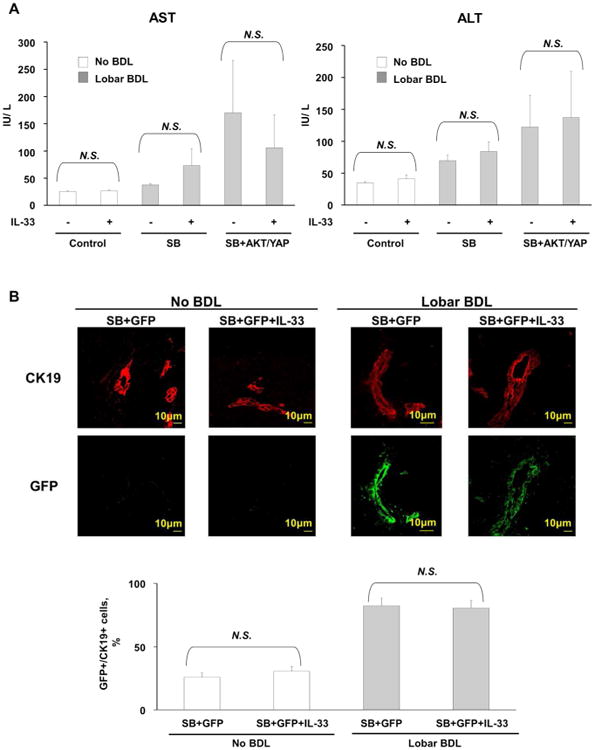
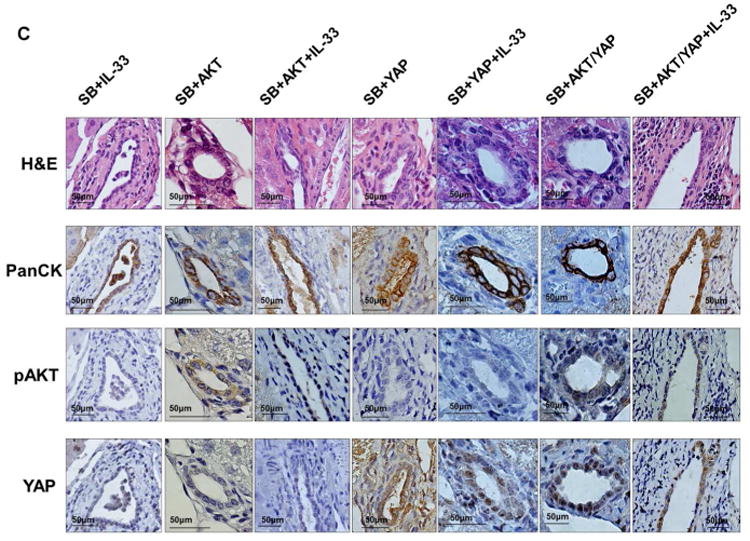
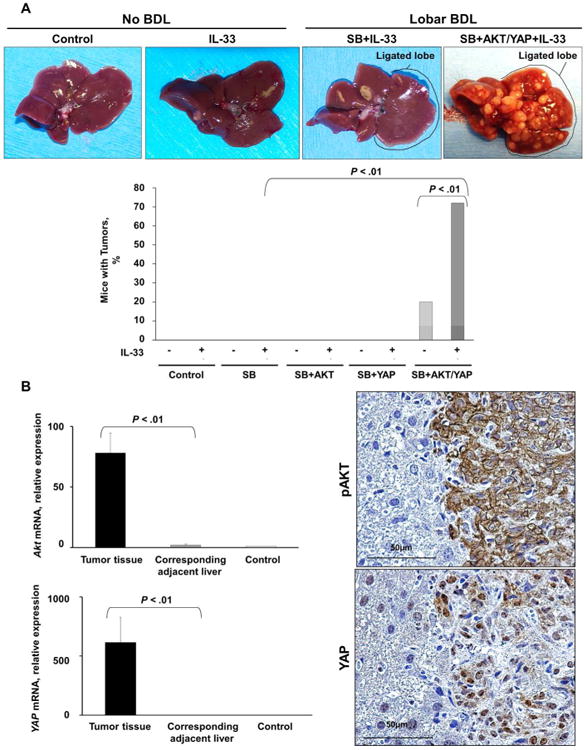
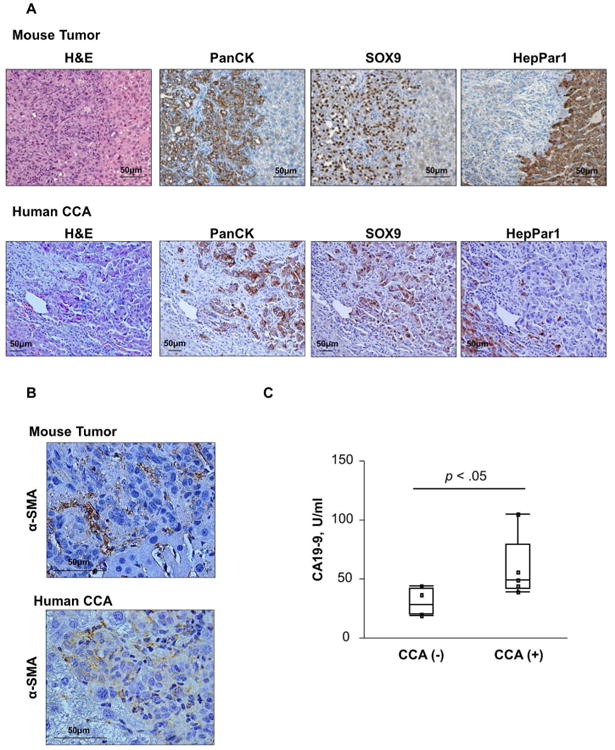
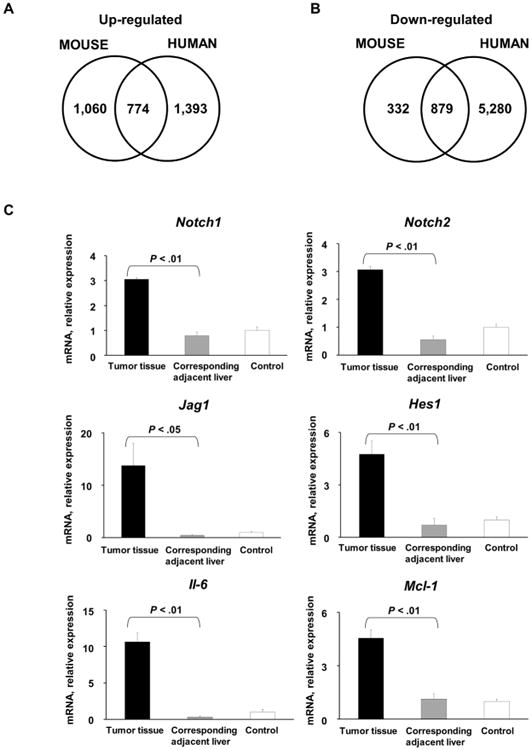
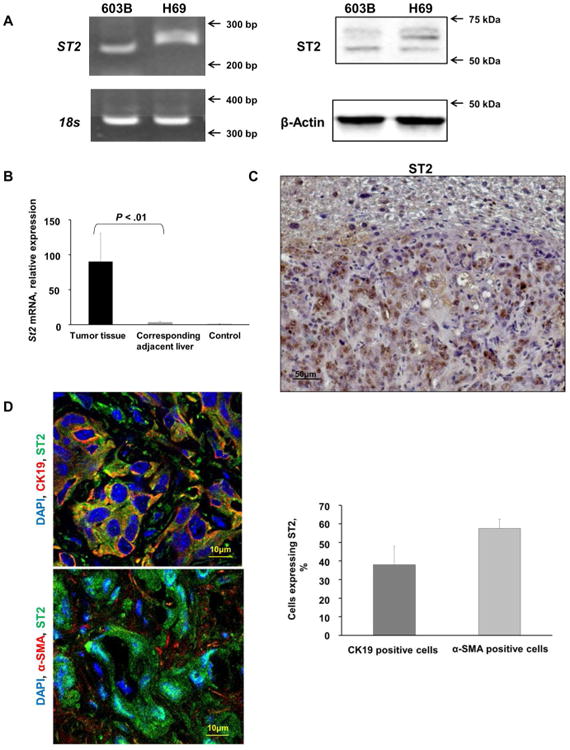
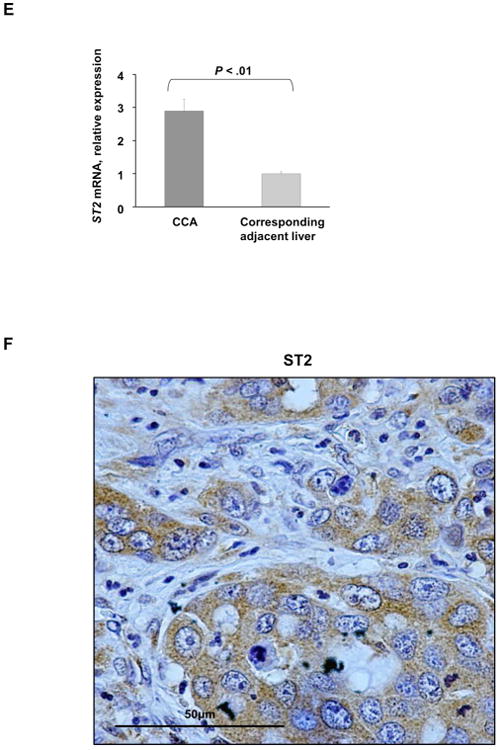
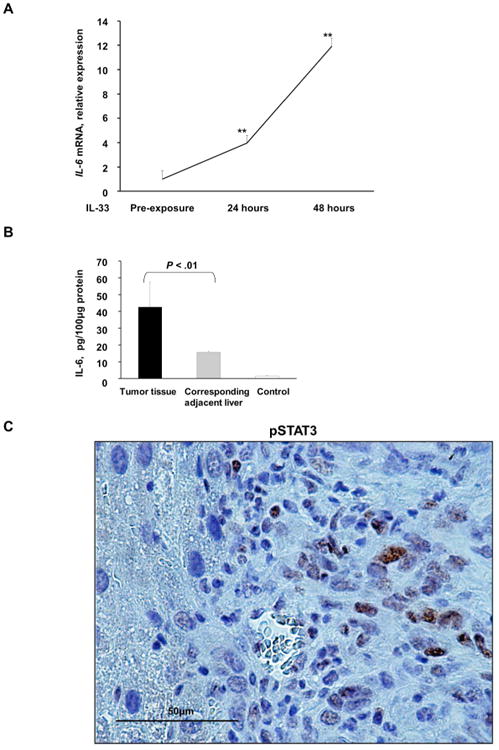
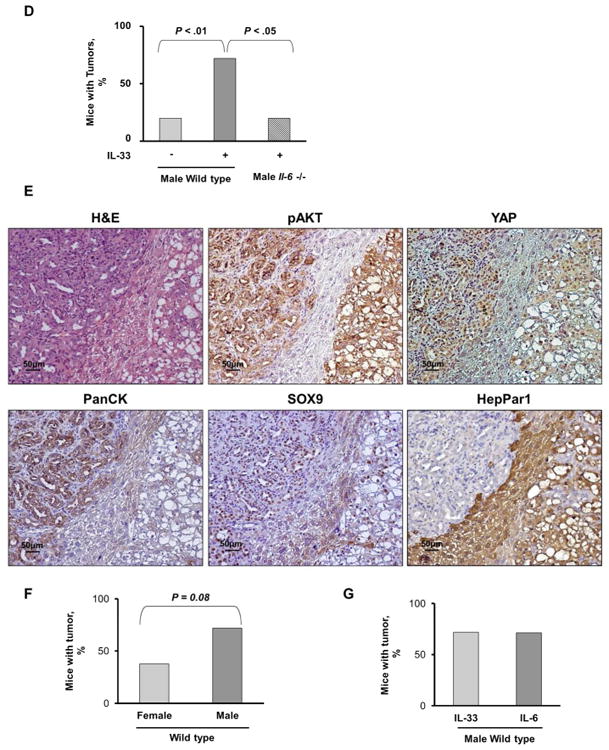
Cholangiocarcinoma (CCA) is a lethal hepatobiliary neoplasm originating from the biliary apparatus. In humans, CCA risk factors include hepatobiliary inflammation and fibrosis. The recently identified interleukin (IL)-1 family member, IL-33, has been shown to be a biliary mitogen which also promotes liver inflammation and fibrosis. Our aim was to generate a mouse model of CCA mimicking the human disease. Ectopic oncogene expression in the biliary tract was accomplished by the Sleeping Beauty transposon transfection system with transduction of constitutively active AKT (myr-AKT) and Yes-associated protein. Intrabiliary instillation of the transposon-transposase complex was coupled with lobar bile duct ligation in C57BL/6 mice, followed by administration of IL-33 for 3 consecutive days. Tumors developed in 72% of the male mice receiving both oncogenes plus IL-33 by 10 weeks but in only 20% of the male mice transduced with the oncogenes alone. Tumors expressed SOX9 and pancytokeratin (features of CCA) but were negative for HepPar1 (a marker of hepatocellular carcinoma). Substantive overlap with human CCA specimens was revealed by RNA profiling. Not only did IL-33 induce IL-6 expression by human cholangiocytes but it likely facilitated tumor development in vivo by an IL-6-sensitive process as tumor development was significantly attenuated in Il-6(-/-) male animals. Furthermore, tumor formation occurred at a similar rate when IL-6 was substituted for IL-33 in this model.

Conclusion: The transposase-mediated transduction of constitutively active AKT and Yes-associated protein in the biliary epithelium coupled with lobar obstruction and IL-33 administration results in the development of CCA with morphological and biochemical features of the human disease; this model highlights the role of inflammatory cytokines in CCA oncogenesis.


Figures

Figure 1
Figure 1
Biliary tract oncogene transduction of AKT and YAP is an efficient, IL-33-independent process. (A) Levels of the aminotransferases AST and ALT were increased in mice which underwent biliary tract transduction of AKT and YAP and BDL compared to control mice which did not undergo BDL. IL-33 administration did not result in a further increase in aminotransferase levels. [Control (n=5), Control+IL-33 (n=5), SB (n=5), SB+IL-33 (n=5), SB+AKT+YAP (n=10), SB+AKT+YAP+IL-33 (n=25)]; Mean + SD are depicted. (B) Immunofluorescence was used to detect GFP in cholangiocytes (CK19 positive cells) in mice which had undergone biliary transduction of SB+GFP with or without systemic IL-33 administration and BDL (upper panel). The number of GFP and CK19 positive cells was quantified in 5 high power fields and expressed as a percentage of total (lower panel). Mean + SD are depicted for n=5. Original magnification: 63×. (C) Representative photomicrograph of hematoxylin and eosin-stained (H&E) sections from the ligated lobes of mice sacrificed 10 weeks after undergoing biliary transduction of SB +/-AKT +/-YAP with or without systemic IL-33 administration (top panels). Immunohistochemistry was used to detect PanCK, pAKT, and YAP expression in these mice (2nd, 3rd, and bottom panels, respectively). Original magnification: 60×.
Figure 1
Figure 1
Biliary tract oncogene transduction of AKT and YAP is an efficient, IL-33-independent process. (A) Levels of the aminotransferases AST and ALT were increased in mice which underwent biliary tract transduction of AKT and YAP and BDL compared to control mice which did not undergo BDL. IL-33 administration did not result in a further increase in aminotransferase levels. [Control (n=5), Control+IL-33 (n=5), SB (n=5), SB+IL-33 (n=5), SB+AKT+YAP (n=10), SB+AKT+YAP+IL-33 (n=25)]; Mean + SD are depicted. (B) Immunofluorescence was used to detect GFP in cholangiocytes (CK19 positive cells) in mice which had undergone biliary transduction of SB+GFP with or without systemic IL-33 administration and BDL (upper panel). The number of GFP and CK19 positive cells was quantified in 5 high power fields and expressed as a percentage of total (lower panel). Mean + SD are depicted for n=5. Original magnification: 63×. (C) Representative photomicrograph of hematoxylin and eosin-stained (H&E) sections from the ligated lobes of mice sacrificed 10 weeks after undergoing biliary transduction of SB +/-AKT +/-YAP with or without systemic IL-33 administration (top panels). Immunohistochemistry was used to detect PanCK, pAKT, and YAP expression in these mice (2nd, 3rd, and bottom panels, respectively). Original magnification: 60×.
Figure 2
Figure 2
Biliary transduction of murine AKT plus human YAP combined with systemic IL-33 facilitates biliary tumorigenesis. (A) Liver appearance of mice ten weeks after having undergone biliary transduction of SB+/-AKT+/-YAP coupled with BDL and subsequent systemic IL-33 administration (1 μg i.p. for 3 days) (upper panels). Black line surrounds the ligated lobe. Percentage of animals with tumors (lower panel). (Control, n=5; Control+IL-33, n=5; SB, n=5; SB+IL-33, n=5; SB+AKT, n=5; SB+AKT+IL-33, n=5; SB+YAP, n=5; SB+YAP+IL-33, n=5; SB+AKT/YAP, n=10; SB+AKT/YAP+IL-33, n=17). (B) Mice with biliary transduction of AKT and YAP have increased expression of these oncogenes. Expression of Akt and YAP was quantified in mouse tumor tissue, corresponding adjacent tissue, and control mouse liver tissue by qRT-PCR (left panels). Mean + SD are depicted for n=5 (control mouse liver tissue) and n=4 (tumor and corresponding adjacent tissue). Immunohistochemistry was used to detect phospho-AKT (pAKT) and YAP in mouse tumor and corresponding adjacent liver tissue (right panels). Original magnification: 60×. I.p., intraperitoneal.
Figure 3
Figure 3
Murine tumors have histological resemblance and phenotypic features of human CCA. (A) Representative photomicrograph of hematoxylin and eosin-stained tumor sections and adjacent liver from mice having undergone biliary transduction of AKT+YAP coupled with BDL and systemic IL-33 administration (1 μg daily for 3 days) (upper panel) and human CCA tissue are shown (lower panel). Immunohistochemistry was used to detect PanCK, SOX9, and HepPar1 in these murine tumors (upper panels) and human CCA (lower panels). Original magnification: 20×. (B) Immunohistochemistry was used to detect α-SMA in murine tumors (left panel) and human CCA (right panel). Original magnification: 60×. (C) ELISA was used to detect CA 19-9 levels in murine tumor tissue and control liver.
Figure 4
Figure 4
Comparison of upregulated and downregulated genes in murine tumors. (A) Venn diagram illustrating genes that are upregulated in both murine tumors and human CCA specimens (n=30) compared to corresponding normal livers. (B) Venn diagram illustrating genes that are downregulated in both murine tumors and human CCA specimens (n=30) compared to corresponding normal livers. (C) Expression of Notch1, Notch2, Jag1, Hes 1, Mcl-1, and Il-6 was quantified in murine tumors, corresponding adjacent liver, and mouse control liver by qRT-PCR. Mean + SD are depicted for n=5 (control mouse liver tissue) and n=4 (tumor and corresponding adjacent tissue).
Figure 5
Figure 5
The IL-33 receptor, ST2, is present in murine tumors and human immortalized, non-malignant cholangiocytes and its expression is increased in murine tumors. (A) Expression of ST2 was assessed in mouse (603B) and human immortalized, non-malignant (H69) cholangiocytes using qualitative PCR (left panel) and immunoblot analysis (right panel). 18s was used as a normalization control for PCR and β-Actin was used as a loading control for immunoblot analysis. (B) Expression of St2 was quantified in murine tumors, corresponding adjacent liver, and mouse control liver by qRT-PCR. Mean + SD are depicted for n=5 (control mouse liver tissue) and n=4 (tumor and corresponding adjacent tissue). (C) Immunohistochemistry was used to detect ST2 in murine tumors and corresponding adjacent liver. Original magnification 20×. (D) Immunofluorescence was used to detect ST2 in murine CCA cells (CK19 positive) compared to CAF (α-SMA positive) (left panel). The number of ST2 positive CCA cells and CAF was quantified in 5 high power fields and expressed as a percentage of total. Mean + SD are depicted for n =7 (right panel). Original magnification: 63×. (E) Expression of ST2 was quantified in human resected CCA specimens and corresponding normal livers by qRT-PCR. Mean + SD are depicted for n=12. (F) Immunohistochemistry was used to detect ST2 in human resected CCA specimens. Original magnification: 60×.
Figure 5
Figure 5
The IL-33 receptor, ST2, is present in murine tumors and human immortalized, non-malignant cholangiocytes and its expression is increased in murine tumors. (A) Expression of ST2 was assessed in mouse (603B) and human immortalized, non-malignant (H69) cholangiocytes using qualitative PCR (left panel) and immunoblot analysis (right panel). 18s was used as a normalization control for PCR and β-Actin was used as a loading control for immunoblot analysis. (B) Expression of St2 was quantified in murine tumors, corresponding adjacent liver, and mouse control liver by qRT-PCR. Mean + SD are depicted for n=5 (control mouse liver tissue) and n=4 (tumor and corresponding adjacent tissue). (C) Immunohistochemistry was used to detect ST2 in murine tumors and corresponding adjacent liver. Original magnification 20×. (D) Immunofluorescence was used to detect ST2 in murine CCA cells (CK19 positive) compared to CAF (α-SMA positive) (left panel). The number of ST2 positive CCA cells and CAF was quantified in 5 high power fields and expressed as a percentage of total. Mean + SD are depicted for n =7 (right panel). Original magnification: 63×. (E) Expression of ST2 was quantified in human resected CCA specimens and corresponding normal livers by qRT-PCR. Mean + SD are depicted for n=12. (F) Immunohistochemistry was used to detect ST2 in human resected CCA specimens. Original magnification: 60×.
Figure 6
Figure 6
IL-33 induces IL-6 expression in murine normal cholangiocytes and tumors. (A) Expression of Il-6 was quantified using qRT-PCR in murine immortalized, non-malignant cholangiocytes prior to IL-33 exposure and 24 and 48 h after IL-33 (10 ng/mL) exposure. Mean + SD are depicted for n=5, ** P < .01. (B) ELISA was used to detect IL-6 levels in murine tumor tissue, corresponding adjacent liver, and control liver. Mean + SD are depicted for n=3 (murine tumor and corresponding adjacent liver) and n=5 (murine control liver). (C) Immunohistochemistry was used to detect phospho-STAT3 (pSTAT3) in murine tumors. Original magnification: 60×. (D) Il-6 -/- mice were sacrificed 10 weeks after having undergone biliary transduction of SB+AKT+YAP coupled with BDL and subsequent systemic IL-33 administration (1 μg i.p. for 3 days). Percentage of animals with tumors (n=5). (E) Representative photomicrograph of hematoxylin and eosin-stained tumor sections (H&E) and adjacent liver are shown. Immunohistochemistry was used to detect pAKT, YAP, PanCK, SOX9, and HepPar1 expression in these mice. Original magnification: 20×. (F) Female C57BL/6 mice were sacrificed 10 weeks after having undergone biliary transduction of SB+AKT+YAP coupled with BDL and subsequent systemic IL-33 administration (1 μg i.p. for 3 days). Percentage of animals with tumors (n=8). (G) Male C57BL/6 mice were sacrificed 10 weeks after having undergone biliary transduction of SB+AKT+YAP coupled with BDL and subsequent systemic IL-6 administration (1 μg i.p. for 3 days). Percentage of animals with tumors (n=7).
Figure 6
Figure 6
IL-33 induces IL-6 expression in murine normal cholangiocytes and tumors. (A) Expression of Il-6 was quantified using qRT-PCR in murine immortalized, non-malignant cholangiocytes prior to IL-33 exposure and 24 and 48 h after IL-33 (10 ng/mL) exposure. Mean + SD are depicted for n=5, ** P < .01. (B) ELISA was used to detect IL-6 levels in murine tumor tissue, corresponding adjacent liver, and control liver. Mean + SD are depicted for n=3 (murine tumor and corresponding adjacent liver) and n=5 (murine control liver). (C) Immunohistochemistry was used to detect phospho-STAT3 (pSTAT3) in murine tumors. Original magnification: 60×. (D) Il-6 -/- mice were sacrificed 10 weeks after having undergone biliary transduction of SB+AKT+YAP coupled with BDL and subsequent systemic IL-33 administration (1 μg i.p. for 3 days). Percentage of animals with tumors (n=5). (E) Representative photomicrograph of hematoxylin and eosin-stained tumor sections (H&E) and adjacent liver are shown. Immunohistochemistry was used to detect pAKT, YAP, PanCK, SOX9, and HepPar1 expression in these mice. Original magnification: 20×. (F) Female C57BL/6 mice were sacrificed 10 weeks after having undergone biliary transduction of SB+AKT+YAP coupled with BDL and subsequent systemic IL-33 administration (1 μg i.p. for 3 days). Percentage of animals with tumors (n=8). (G) Male C57BL/6 mice were sacrificed 10 weeks after having undergone biliary transduction of SB+AKT+YAP coupled with BDL and subsequent systemic IL-6 administration (1 μg i.p. for 3 days). Percentage of animals with tumors (n=7).

Comment in

References

    1. Rizvi S, Gores GJ. Pathogenesis, diagnosis, and management of cholangiocarcinoma. Gastroenterology. 2013;145:1215–29. - PMC - PubMed
    1. Tyson GL, El-Serag HB. Risk factors for cholangiocarcinoma. Hepatology. 2011;54:173–84. - PMC - PubMed
    1. Sia D, Hoshida Y, Villanueva A, Roayaie S, Ferrer J, Tabak B, Peix J, Sole M, Tovar V, Alsinet C, Cornella H, Klotzle B, Fan JB, Cotsoglou C, Thung SN, Fuster J, Waxman S, Garcia-Valdecasas JC, Bruix J, Schwartz ME, Beroukhim R, Mazzaferro V, Llovet JM. Integrative molecular analysis of intrahepatic cholangiocarcinoma reveals 2 classes that have different outcomes. Gastroenterology. 2013;144:829–40. - PMC - PubMed
    1. Sirica AE. The role of cancer-associated myofibroblasts in intrahepatic cholangiocarcinoma. Nat Rev Gastroenterol Hepatol. 2012;9:44–54. - PubMed
    1. Everhart JE, Ruhl CE. Burden of digestive diseases in the United States Part III: Liver, biliary tract, and pancreas. Gastroenterology. 2009;136:1134–44. - PubMed

Publication types