. 2015 Feb;17(2):170-82.
doi: 10.1038/ncb3090. Epub 2015 Jan 12.

Periostin secreted by glioblastoma stem cells recruits M2 tumour-associated macrophages and promotes malignant growth

Affiliations

Periostin secreted by glioblastoma stem cells recruits M2 tumour-associated macrophages and promotes malignant growth

Wenchao Zhou et al. Nat Cell Biol. 2015 Feb.

Abstract

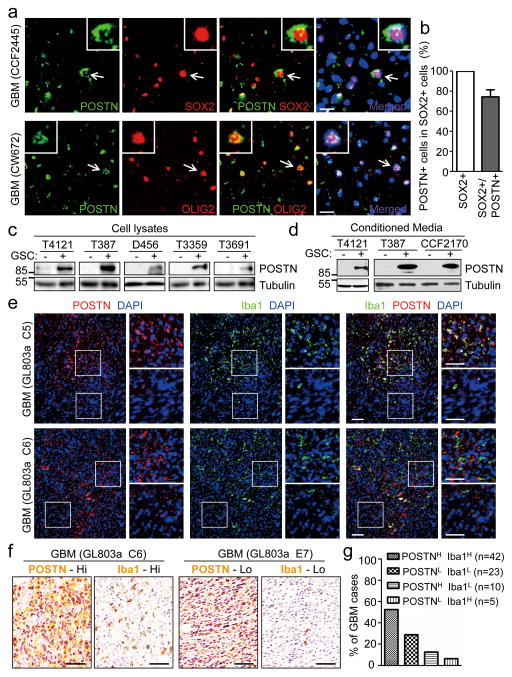
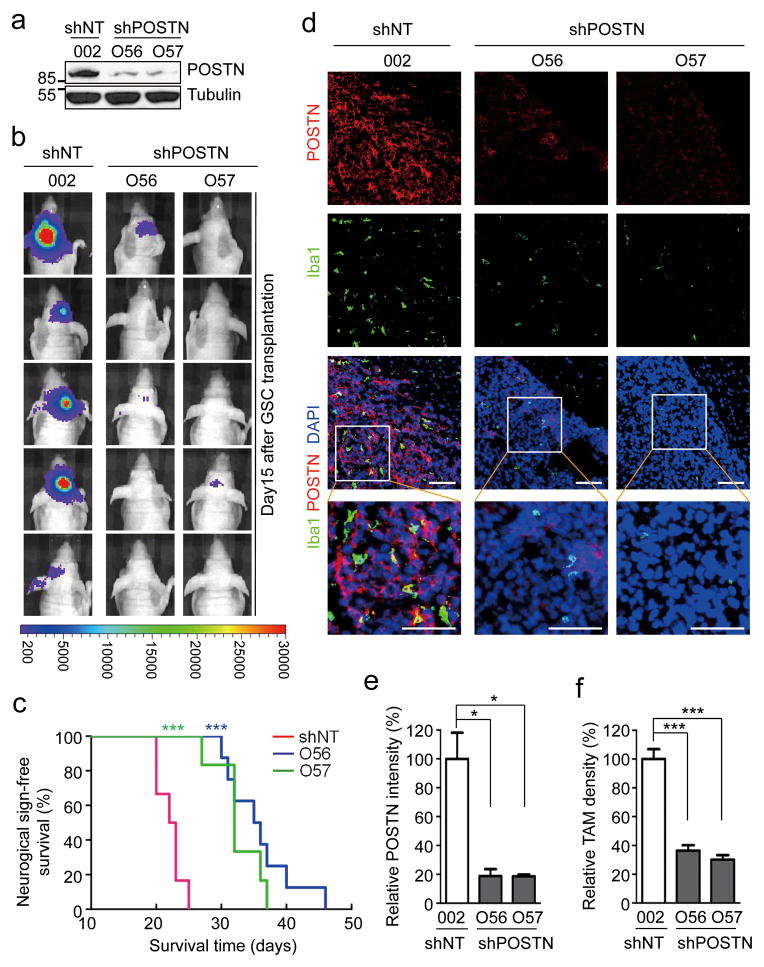
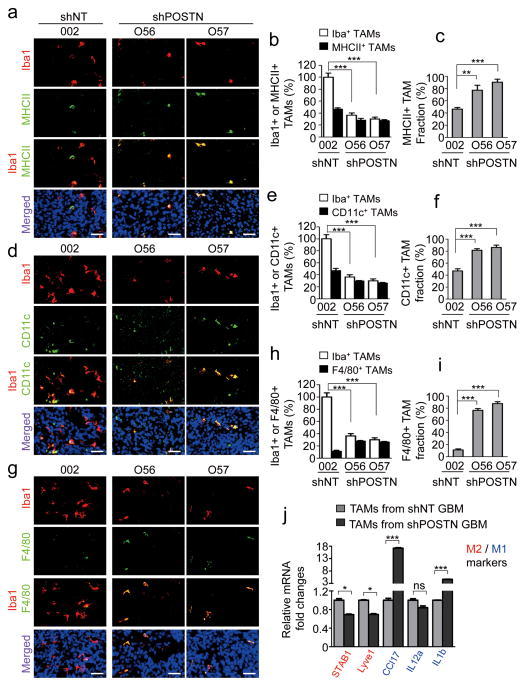
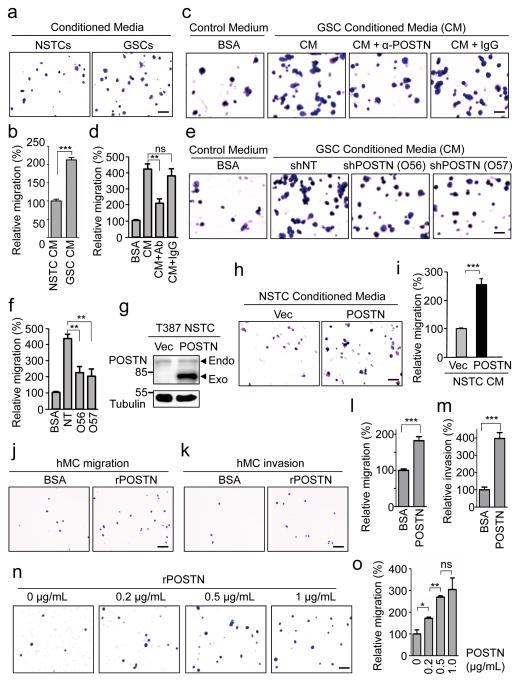
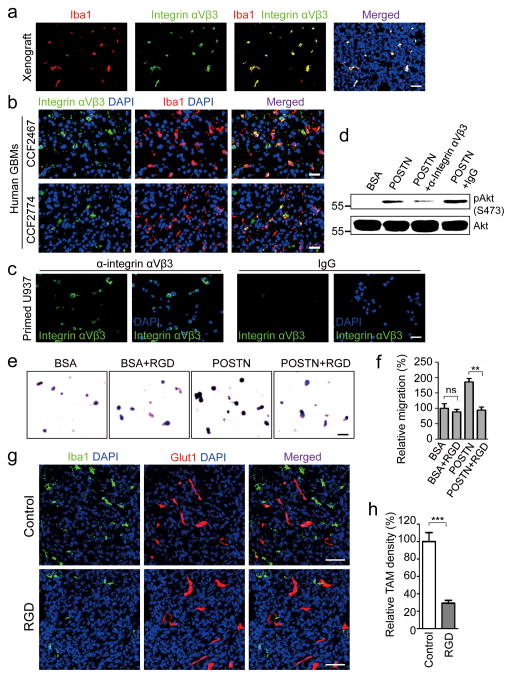
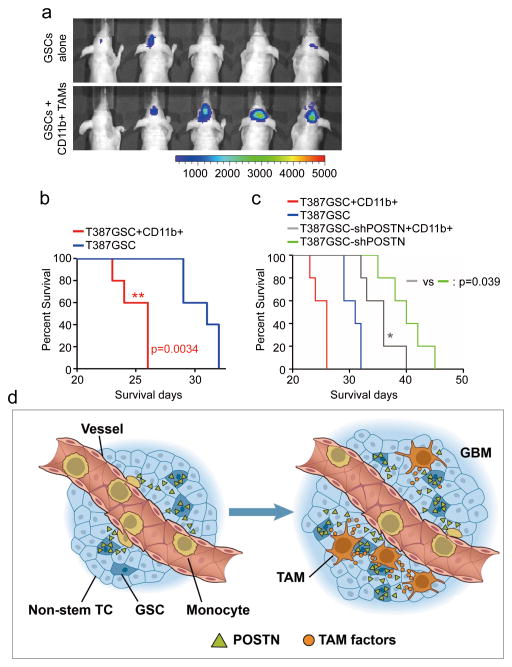
Tumour-associated macrophages (TAMs) are enriched in glioblastoma multiformes (GBMs) that contain glioma stem cells (GSCs) at the apex of their cellular hierarchy. The correlation between TAM density and glioma grade suggests a supportive role for TAMs in tumour progression. Here we interrogated the molecular link between GSCs and TAM recruitment in GBMs and demonstrated that GSCs secrete periostin (POSTN) to recruit TAMs. TAM density correlates with POSTN levels in human GBMs. Silencing POSTN in GSCs markedly reduced TAM density, inhibited tumour growth, and increased survival of mice bearing GSC-derived xenografts. We found that TAMs in GBMs are not brain-resident microglia, but mainly monocyte-derived macrophages from peripheral blood. Disrupting POSTN specifically attenuated the tumour-supportive M2 type of TAMs in xenografts. POSTN recruits TAMs through the integrin αvβ₃ as blocking this signalling by an RGD peptide inhibited TAM recruitment. Our findings highlight the possibility of improving GBM treatment by targeting POSTN-mediated TAM recruitment.


Conflict of interest statement

The authors declare no competing financial interests.

Figures

Figure 1
Figure 1. POSTN is preferentially secreted by GSCs and its levels correlate with TAM density in GBMs
a, Immunofluorescent staining of POSTN (green) and the GSC marker OLIG2 or SOX2 (red) in human primary GBMs. Frozen sections of GBMs (CCF2445 and CW672) were immunostained with antibodies against POSTN and SOX2 or OLIG2, and counterstained with DAPI to show nuclei (blue). POSTN was preferentially expressed in GSCs and distributed in the area near GSCs. Scale bar, 20μm. b, Graphical analysis of (a) showing the fraction of POSTN+ cells in SOX2+ cells (GSCs) in human primary GBMs. More than 70% of SOX2 positive GSCs showed POSTN staining (n=5 GBMs; mean ± s.e.m.). c and d, Immunoblot analysis of POSTN expression in cell lysates (c) and conditioned media (CM) (d) from GSCs (+) and matched non-stem tumor cells (−). CMs were obtained by culturing equal numbers of GSCs and non-stem tumor cells in Neurobasal media without supplements for 24 hours and concentrating media by vacuum centrifugation. Endogenous tubulin amounts in the corresponding cells were used for control. e, Immunofluorescent analysis of POSTN (red) and the TAM marker Iba1 (green) in GBM tissue microarray (US Biomax). Two sets of representative staining were presented to show the enrichment of TAMs in POSTN abundant regions in GBMs. Areas indicated with squares were enlarged and shown on right side of each picture. Scale bar, 80μm. f, Immunohistochemical staining of POSTN and the TAM marker Iba1 in two consecutive tissue microarray slides, respectively. Representative staining images show that the GBM (GL803a-C6) with higher POSTN levels contained more Iba1+ cells (TAMs) and the GBM (GL803a-E7) with lower POSTN levels has less Iba1+ (TAMs). Scale bar, 40μm. g, Graphical analysis of POSTN and Iba1 staining in the tissue microarray slides. 52.5% of GBM cases showed POSTNHigh and Iba1High staining, and 28.75% of GBM cases showed POSTNLow and Iba1Low staining. Only 12.5% of GBM cases showed POSTNHigh but Iba1Low staining, and 6.25% of GBM cases showed POSTNLow but Iba1High staining. The majority (81.25%) of GBM cases showed that POSTN levels positively correlate with TAM density. (Data from 80 tumors).
Figure 2
Figure 2. Disrupting POSTN by shRNA markedly inhibited tumor growth and reduced TAM density in GSC-derived xenografts
a, Immunoblot analysis of POSTN in GSCs expressing non-targeting shRNA (shNT) or POSTN shRNA (shPOSTN). Targeting POSTN by two distinct shRNA clones O56 and O57 through lentiviral infection reduced POSTN expression by 85–90% in GSCs (T387). b, In vivo bioluminescent imaging analysis of tumor growth in mice bearing GBM xenografts derived from GSCs expressing shNT or shPOSTN. GSCs (T387) were transduced with firefly luciferase and shPOSTN or shNT and then engrafted intracranially into athymic nude mice. Representative images on day 15 post transplantation were shown (data from 5 mice). Silencing POSTN by both O56 and O57 shRNA clones dramatically delayed tumor growth. c, Kaplan-Meier survival curves of mice implanted with GSCs expressing shPOSTN or shNT (control). GSCs were transduced with shPOSTN (O56 or O57) or shNT through lentiviral infection and then were transplanted intracranially into athymic nude mice (20,000 cells per mouse). Survival curves were analyzed by two-tailed log-rank test. Mice bearing GSC-derived tumors expressing shPOSTN showed a significant survival extension relative to the control group. ***, p<0.001 (n=6 mice for shNT and O57, and n=8 mice for O56). d, Immunofluorescent analysis of POSTN (red) and the TAM marker Iba1 (green) in GBM tumors derived from GSCs expressing shPOSTN or shNT. Frozen sections of GBM tumors derived from GSCs with shPOSTN (O56 and O57) or shNT were immunostained with antibodies against POSTN and Iba1 and counterstained with DAPI (blue). Marked reductions of POSTN and Iba1 (TAMs) signals were detected in the GSC-derived tumors expressing shPOSTN. Scale bar, 80μm. e and f, Graphical analyses of (d) showing a decrease of POSTN signal intensity by ~80% and a significant reduction of TAM density by ~60% in the GSC-derived tumors expressing shPOSTN. POSTN intensity and TAM density were analyzed with ImageJ. *, p<0.05; ***, p<0.001 (n=5 tumors; mean ± s.e.m.; two tailed unpaired t-test).
Figure 3
Figure 3. TAMs in human primary GBMs and xenografts are monocyte-derived macrophages from peripheral blood
a, Immunofluorescent staining of CCR2 (the marker for monocyte-derived macrophages) and CX3CR1 (the microglia marker) in GBM xenograft and normal brain tissue. Frozen sections of GSC-derived tumor (T387) and the adjacent normal mouse brain were immunostained with antibodies against CCR2 (green) and CX3CR1 (red) and counterstained with DAPI (blue). CCR2+ cells were detected only in tumor tissue, while CX3CR1+ cells were detected only in normal brain. Scale bar, 40μm. b, Immunohistochemical staining of CCR2 and CX3CR1 in human primary GBMs and normal brain tissue. Two consecutive tissue microarray slides (US Biomax) containing GBMs and normal brain tissues were immunostained with antibody against CCR2 or CX3CR1 (brown) and counterstained with hematoxylin. GBM tumors showed abundant CCR2+ cells (the monocyte-derived TAMs) but not CX3CR1+ cells (microglia), while normal brain tissues contained CX3CR1+ cells but not CCR2+ cells. Scale bar, 40μm. c, Graphical analysis of (b) in tissue microarrays showed that CCR2+ cells (monocyte-derived TAMs) were detected in the majority (82.6%) of GBM cases (data from 23 tumors) and the minority (20%) of normal brains (data from 5 normal samples). In contrast, CX3CR1+ cells (microglia) were detected in all normal brains but only 4.3% of GBM tumor cases. d, Immunofluorescent staining of Iba1 and the CD31 in human primary GBMs. Frozen sections of a primary GBM (CW2445) were immunostained with antibodies against Iba1 to label TAMs (green) and CD31 to mark vessels (red) and counterstained with DAPI (blue). Abundant TAMs are enriched in perivascular niches. Scale bar, 80μm. e, Immunofluorescent staining of the TAM marker Iba1 and the endothelial marker Glut1 in GSC-derived xenografts. Frozen sections of GBM xenografts derived from GSCs (T387) were immunostained with antibodies against Iba1 (green) and Glut1 (red) and counterstained with DAPI (blue). TAMs (green) were localized near vessels but not in the area lacking blood vessel. Scale bar, 80μm.
Figure 4
Figure 4. POSTN-recruited TAMs are maintained as M2 subtype in GSC-derived xenografts
a, Immunofluorescent staining of the M2 TAM marker Fizz1 (green) and the pan macrophage marker Iba1 (red) in GSC-derived tumors expressing shPOSTN (O56 and O57) or shNT (control). Nuclei were counterstained with DAPI (blue)). Scale bar, 40μm. b and c, Graphical analyses of (a) showing a significant reduction of Fizz1+ M2 subtype TAM density (b) and ratio (c) in shPOSTN-expressing xenografts relative to shNT-expressing xenografts. Relative M2 TAM density was normalized to total TAMs in shNT expressing xenografts. The M2 TAM fraction (ratio) was determined by the percentage of M2 TAMs within TAM population in shNT or shPOSTN xenografts, respectively. ***, p<0.001 (n=5 tumors; mean ± s.e.m.; two tailed unpaired t-test). d, Immunofluorescent staining of the M2 TAM marker CD163 (green) and the pan macrophage marker Iba1 (red) in GSC-derived tumors expressing shPOSTN or shNT. Scale bar, 40μm. e and f, Graphical analyses of (d) showing a significant reduction of CD163+ M2 subtype TAM density (e) and ratio (f) in shPOSTN-expressing xenografts relative to shNT-expressing xenografts. ***, p<0.001 (n=5 tumors; mean ± s.e.m.; two tailed unpaired t-test). g, Immunofluorescent staining of the M2 TAM marker Arg1 (green) and the pan macrophage marker CD11b (red) in GSC-derived tumors expressing shPOSTN or shNT. Scale bar, 40μm. h and i, Graphical analyses of (g) showing a significant reduction of Arg1+ M2 subtype TAM density (h) and ratio (i) in shPOSTN-expressing xenografts relative to shNT-expressing xenografts. *, p<0.05 (n=5 tumors; mean ± s.e.m.; two tailed unpaired t-test). j, In vivo bioluminescent imaging showing the accelerated tumor growth of intracranial xenografts from POSTN-overexpressing (POSTN-OE). Representative images on day 16 post transplantation were shown (data from 5 mice). k, Graphical analysis of tumors in (j) showing an increase of M2 TAMs in xenografts overexpressing POSTN relative to the control tumor (vector). Frozen sections were stained with the M2 TAM marker CD163 or Fizz1 together with the vessel marker Glut1. CD163+ and Fizz1+ cell numbers were normalized to vessel density. ***, p<0.001 (n=5 tumors; mean ± s.e.m.; two tailed unpaired t-test).
Figure 5
Figure 5. Silencing POSTN in GSCs increased relative fraction of M1 subtype TAMs in GSC-derived xenografts
a, Immunofluorescent staining of the M1 TAM marker MHCII (green) and the pan macrophage marker Iba1 (red) in GSC-derived tumors expressing shPOSTN or shNT (control). Nuclei were counterstained with DAPI (blue). Scale bar, 40μm. b and c, Graphical analyses of (a) showing the reduced TAM density (b) but the increased MHCII+ M1 fraction (c) in shPOSTN-expressing tumors relative to shNT expressing tumors. Relative TAM density was normalized to total TAMs in shNT expressing xenografts. The M1 TAM fraction was determined by the percentage of M1 TAMs within TAMs in shNT or shPOSTN xenografts, respectively. ***, p<0.001; **, p<0.01 (n=5 tumors; mean ± s.e.m.; two tailed unpaired t-test). d, Immunofluorescent staining of the M1 TAM marker CD11c (green) and the pan macrophage marker Iba1 (red) in GSC-derived tumors expressing shPOSTN or shNT. Scale bar, 40μm. e and f, Graphical analyses of (d) showing the reduced TAM density (e) but the increased CD11c+ M1 fraction (f) in shPOSTN-expressing tumors relative to shNT expressing tumors. ***, p<0.001 (n=5 tumors; mean ± s.e.m.; two tailed unpaired t-test). g, Immunofluorescent staining of the mature TAM marker F4/80 (green) and the pan macrophage marker Iba1 (red) in GSC-derived tumors expressing shPOSTN or shNT. Scale bar, 40μm. h and i, Graphical analyses of (g) showing the reduced TAM density (h) but the increased F4/80+ mature TAM fraction (i) in shPOSTN-expressing tumors relative to shNT expressing tumors. ***, p<0.001 (n=5 tumors; mean ± s.e.m.; two tailed unpaired t-test). j, qPCR analysis of multiple M1 and M2 macrophage markers in CD11b+ populations from shNT-expressing or shPOSTN-expressing xenografts. M2 macrophage markers STAB1 and Lyve1 were significantly down-regulated in CD11b+ population isolated from shPOSTN-expressing xenografts, whereas M1 marker CCL17 and IL1b were markedly up-regulated. ***, p<0.001; *, p<0.05; ns, p>0.05 (mean ± s.e.m.; n = 3 biologically independent samples per group, one representative experiment shown, and the experiment was repeated 3 times).
Figure 6
Figure 6. GSC-secreted POSTN is a chemoattractant to macrophages and monocytes
a, Representative images of migrated macrophage-like U937 cells toward conditioned media (CM) from matched T387 GSCs and non-stem tumor cells (NSTCs) in transwell assays. Scale bar, 80μm. b, Graphical analysis of (a) showing a significant increase of U937 cell migration toward GSC CM relative to NSTC CM. ***, p<0.001 (n=5 fields; mean ± s.e.m.; two-tailed unpaired t-test). c, Representative images of migrated U937 cells toward GSC CM pre-incubated with or without anti-POSTN (10μg/mL) antibody or IgG. Scale bar, 40μm. d, Graphical analysis of (c) showed that the increased macrophage migration toward GSC CM was attenuated by anti-POSTN antibody. **, p<0.01; ns, p>0.05. (n=5 fields; mean ± s.e.m.; two-tailed unpaired t-test). e, Representative images of migrated U937 cells toward CM from GSCs expressing shPOSTN (O56 and O57) or shNT. Scale bar, 40μm. f, Graphical analysis of (e) showing a significant reduction of migrated U937 cells toward CM from GSCs expressing shPOSTN. **, p<0.01 (n=5 fields; mean ± s.e.m.; two-tailed unpaired t-test). g, Immunoblot analysis of POSTN in NSTCs transduced with POSTN or vector control. h, Representative images of migrated U937 cells toward CM from POSTN-overexpressing or control NSTCs. Scale bar, 80μm. i, Graphical analysis of (h) showing a significant increase of U937 cell migration toward CM from POSTN-overexpressing NSTCs. ***, p<0.001 (n=5 fields; mean ± s.e.m.; two-tailed unpaired t-test). j and k, Representative images of cell migration (j) and invasion (k) of human primary monocytes toward recombinant POSTN (rPOSTN) in transwell assays. Scale bar, 80μm. l and m, Graphical analyses of (j) and (k) showing rPOSTN significantly promotes migration and invasion of human monocytes/macrophages. ***, p<0.001 (n=5 fields; mean ± s.e.m.; two-tailed unpaired t-test). n, Representative images of migrated U937 cells toward different concentration of rPOSTN in transwell assays. Scale bar, 80μm. o, Graphical analysis of (n) showing that the migration of U937 macrophages toward rPOSTN protein was dose-dependent. *, p<0.05; **, p<0.01; ***, p<0.001; ns, p>0.05. (n=5 fields; mean ± s.e.m.; two-tailed unpaired t-test). All transwell assays were repeated three times.
Figure 7
Figure 7. POSTN mediates through αVβ3 integrin signaling to recruit macrophages
a, Immunofluorescent staining of integrin αVβ3 (green) and the TAM marker Iba1 (red) in GSC-derived xenografts. Nuclei were counterstained with DAPI (blue). TAMs (Iba1+) showed positive for integrin αVβ3 in the tumors. Scale bar, 40μm. b, Immunofluorescent staining of integrin αVβ3 (green) and Iba1 (red) in human primary GBMs. A fraction of TAMs (Iba1+) showed positive for integrin αVβ3 in GBM tumors (CCF2774 and CCF2467). Scale bar, 40μm. c, Immunofluorescent staining of integrin αVβ3 (green) in PMA-primed U937 cells. U937 cells were stained positive with anti-integrin αVβ3 antibody. Scale bar, 40μm. d, Immunoblot analysis of POSTN-induced Akt activation that was attenuated by the antibody against integrin αVβ3 in PMA-primed U937 cells. After serum starvation overnight, cells were incubated with 0.1mg/ml anti-integrin αVβ3 antibody or control IgG for 1 hour followed by stimulation with 0.5mg/ml recombinant POSTN (rPOSTN) for 1 hour. Pre-incubation with anti-integrin αVβ3 antibody but not the control IgG dramatically inhibited POSTN-induced phosphorylation of Akt. e, Representative images of migrated U937 cells toward rPOSTN in the presence of inhibitory RGD peptide in transwell assays. PMA-primed U937 cells pre-incubated with or without RGD peptide (1 mg/ml) were used for assessing cell migration toward rPOSTN protein (0.2 μg/mL) or 0.1% BSA. Scale bar, 40μm. f, Graphical analysis of (e) showing that pre-incubation of U937 cells with the RGD inhibitory peptide significantly reduced U937 cell migration toward rPOSTN. **, p<0.01; ns, p>0.05. (n=5 fields; mean ± s.e.m.; the experiment was repeated 3 times and analyzed by two tailed unpaired t-test). g, Immunofluorescent analysis of the TAM marker Iba1 (green) and the vessel marker Glut1 (red) in GBM xenografts treated with RGD inhibitory peptide or control peptide. Scale bar, 80μm. h, Graphical analysis of (g) showing a significant reduction of TAM density by ~70% in the GBM tumors treated with the RGD inhibitory peptide. ***, p<0.001 (n=5 tumors; mean ± s.e.m.; two tailed unpaired t-test).
Figure 8
Figure 8. M2 subtype TAMs accelerated GSC tumor growth in mouse brains
a, In vivo bioluminescent imaging analysis of tumor growth in mice bearing GBM xenografts derived from GSCs plus CD11b+ cells (enriched with M2 TAMs) or GSCs alone. 50, 000 CD11b+ cells were isolated from GSC-derived xenografts and then co-transplanted with 20, 000 GSCs intracranially into athymic nude mice. Representative images on day 18 post transplantation were shown (data from 5 mice). Co-transplantation of GSCs with CD11b+ TAMs dramatically promoted GSC tumor growth. b, Kaplan-Meier survival curves of mice implanted with GSCs plus CD11b+ cells or GSCs alone. Mice implanted with T387 GSCs plus CD11b+ cells showed a significantly shortened survival relative to the mice implanted with GSCs alone. p=0.0034. (n=5 mice for each group; two-tailed log-rank test). c, Kaplan-Meier survival curves of mice implanted with shPOSTN-expressing GSCs plus CD11b+ cells or shPOSTN-expressing GSCs alone. Mice implanted with shPOSTN-expressing GSCs (GSC-shPOSTN) plus CD11b+ cells showed a significantly reduced survival relative to the mice implanted with shPOSTN-expressing GSCs alone. p=0.039 (n=5 mice for each group; two-tailed log-rank test). d, A schematic representation of the POSTN-mediated recruitment of monocyte-derived TAMs from peripheral blood during GBM development. POSTN preferentially secreted by GSCs attracts monocytes from peripheral blood to enter GBM tissues. The POSTN-recruited, monocyte-derived TAMs are co-localized in perivascular niches with GSCs and maintained as M2 subtype macrophages that secret tumor supportive factors to promote GBM growth and progression.

Comment in

References

    1. Deorah S, Lynch CF, Sibenaller ZA, Ryken TC. Trends in brain cancer incidence and survival in the United States: Surveillance, Epidemiology, and End Results Program, 1973 to 2001. Neurosurg Focus. 2006;20:E1. - PubMed
    1. DeAngelis LM. Brain tumors. N Engl J Med. 2001;344:114–123. - PubMed
    1. Hao C, et al. Cytokine and cytokine receptor mRNA expression in human glioblastomas: evidence of Th1, Th2 and Th3 cytokine dysregulation. Acta Neuropathol. 2002;103:171–178. - PubMed
    1. Abou-Ghazal M, et al. The incidence, correlation with tumor-infiltrating inflammation, and prognosis of phosphorylated STAT3 expression in human gliomas. Clin Cancer Res. 2008;14:8228–8235. - PMC - PubMed
    1. Morford LA, Dix AR, Brooks WH, Roszman TL. Apoptotic elimination of peripheral T lymphocytes in patients with primary intracranial tumors. J Neurosurg. 1999;91:935–946. - PubMed

Publication types

MeSH terms