. 2015 Apr;32(2):152-8.
doi: 10.1097/WNP.0000000000000154.

Quantitative EEG is an objective, sensitive, and reliable indicator of transient anesthetic effects during Wada tests

Affiliations

Quantitative EEG is an objective, sensitive, and reliable indicator of transient anesthetic effects during Wada tests

Bin Tu et al. J Clin Neurophysiol. 2015 Apr.

Abstract

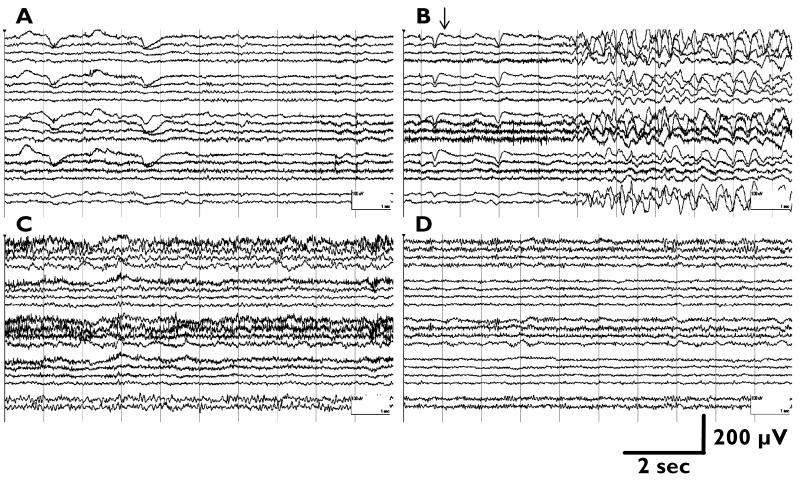
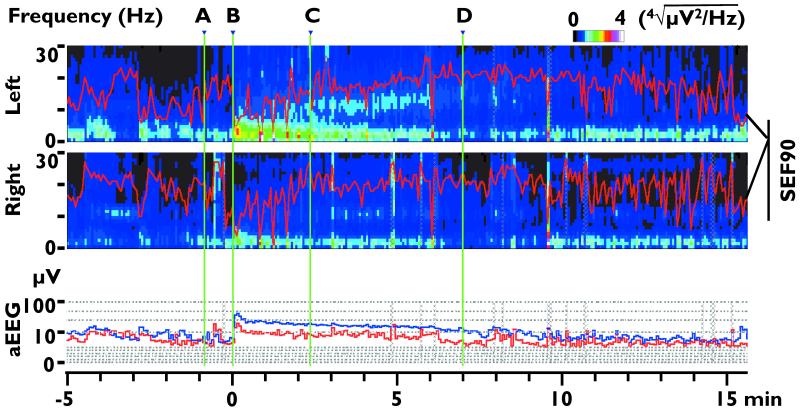
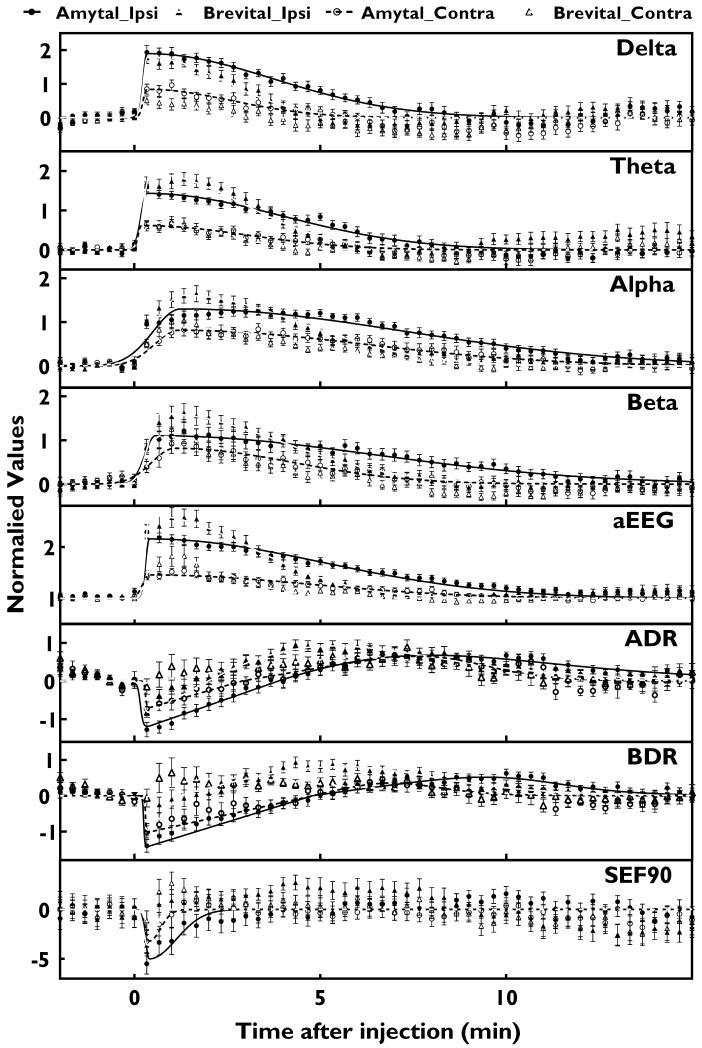
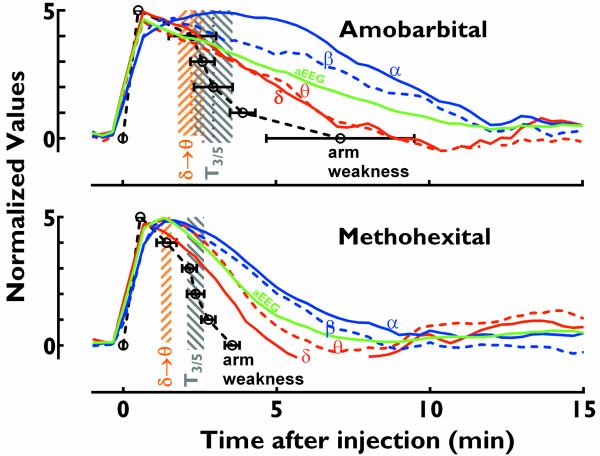
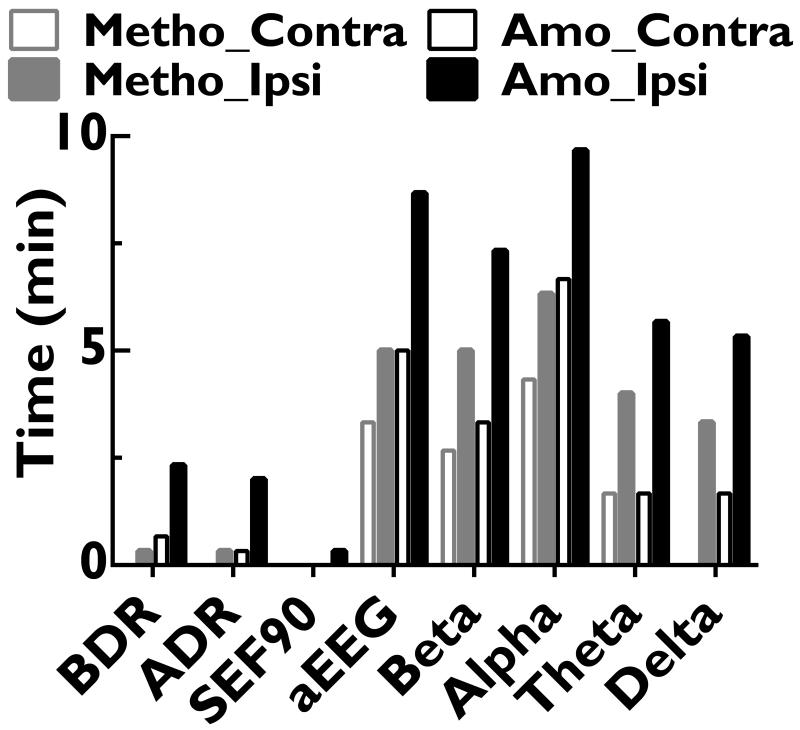
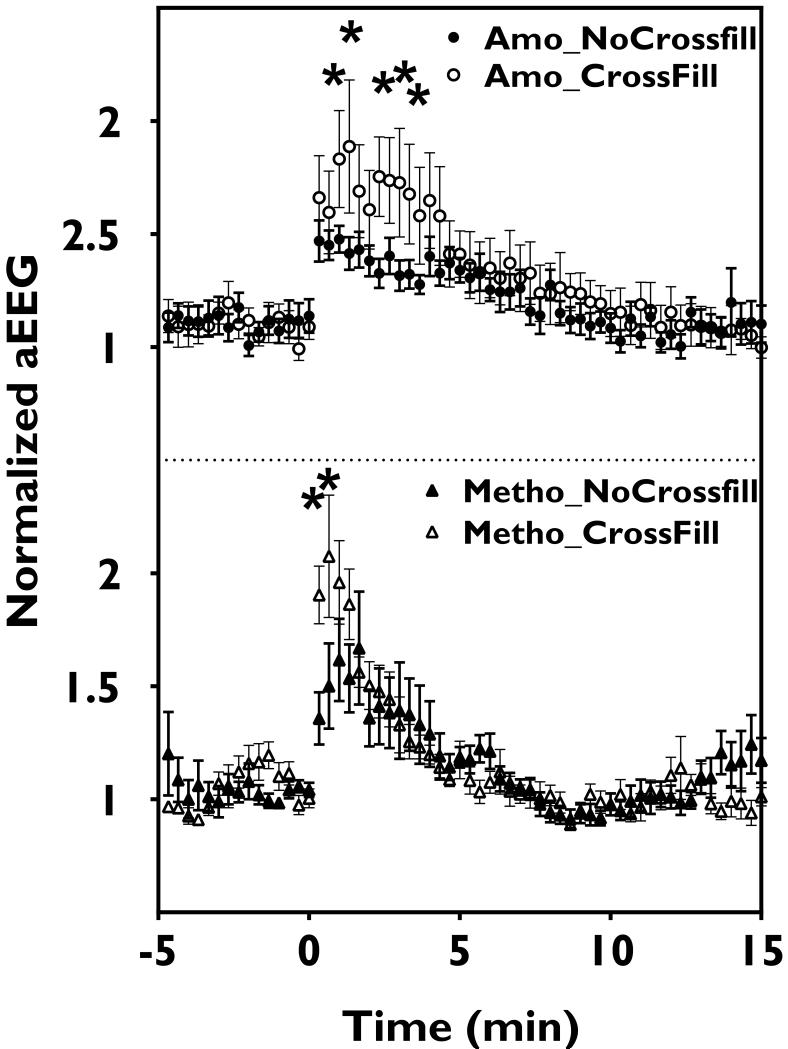
The intracarotid amobarbital or Wada procedure is a component of the presurgical evaluation for refractory epilepsy, during which monitoring the onset and offset of transient anesthetic effects is critical. In this study, the authors characterized changes of 8 quantitative measures during 26 Wada tests, which included alpha, beta, theta, and delta powers, alpha/delta power ratio, beta/delta power ratio, median amplitude-integrated EEG, and 90% spectral edge frequency (SEF90), and correlated them with contralateral hemiplegia. The authors found that on the side of injection, delta and theta powers, alpha/delta power ratio, beta/delta power ratio, and SEF90 peaked within 1 minute after injection of 70 to 150 mg amobarbital or 4 to 7 mg methohexital. When contralateral arm strength returned to 3/5, delta power and amplitude-integrated EEG decayed on average 24% and 19%, respectively, for amobarbital, similar to that of methohexital (27% and 18%). Because delta power resolution most closely mirrored that of the hemiplegia and amplitude-integrated EEG had the highest signal/noise ratio, these quantitative values appear to be the best measures for decay of anesthetic effects. Increase in alpha power persisted longest, and therefore may be the best measure of late residual anesthetic effects.


Figures

Figure 1
Figure 1
An example of Wada EEG in a surgical candidate with left mesial temporal epilepsy. A) Baseline recording, showing left temporal slowing. B) After a left-sided 100 mg amobarbital injection (arrow), increases in bilateral (left more prominent than right) delta and theta, as well as faster frequency (alpha and beta) activity were noted. C) At 2.3 min after injection, more prominent alpha and beta activity and less prominent delta and theta activity was noted than initially. D) At 7 min after injection, EEG returns to baseline with residual left-sided alpha/beta activity. Longitudinal bipolar montage was shown; EEG traces in each panel (start from the top) represent Fp1/F3, F3/C3, C3/P3, P3/O1, (gap), Fp2/F4, F4/C4, C4/P4, P4/O2, F7/P7, P7/O1, (gap), Fp1/F7, F7/T7, T7/P7, P7/O1, (gap), Fp2/F8, F8/T8, T8/P8, P8/O2, (gap), Fz/Cz, Cz/Pz.
Figure 2
Figure 2
Exemplary QEEG corresponding to Figure 1. The upper 2 panels show the left and right compressed spectrum (CSA), and 90% spectral edge frequency (SEF90, red lines overlapped on each spectrum). In order to better illustrate the spectrum in the higher frequency range, the power values (color-coded legend above the 1st panel) in the spectrum represent the 4th root of the actual power value. Lower panel shows aEEG median values of both sides (blue line: left; red line: right). The green vertical lines labeled A-D correspond to time points of panels in Figure 1. The vertical axis of aEEG is at 0-10 μV range on a linear scale and at 10-100 μV range on a logarithmic scale.
Figure 3
Figure 3
Changes in QEEG measures on ipsilateral (closed data points) and contralateral (open data points) hemispheres of the brain evoked by amobarbital (circle) and methohexital (triangle) injections. Data points and error bars represent average and s.e.m. of power values in 20 sec segments of EEG calculated from 26 injections from 13 patients. For delta, theta, alpha, beta, ADR, and BDR, values are normalized logarithmic power values using average values within 1 min before each injection as controls. For aEEG, values were percentage of control period. SEF90 values represent frequency change in Hz from control. The solid lines (ipsilateral) and dashed lines (contralateral) are non-linearly fit curves after amobarbital (black) and methohexital (gray) injections.
Figure 4
Figure 4
Clinical correlation of QEEG values. Correlation of amplitude-normalized average ipsilateral QEEG trends for delta (σ, red solid line), theta (zθ, red dashed line), aEEG (green line), beta (β, blue dashed line), and alpha (α, blue solid line) with arm weakness (black open circles: average values; error bars, s.e.m.) in response to amobarbital (upper panel) and methohexital (lower panel) injections. Delta-to-theta transition time (σ θ, brown shadow) is earlier than the arm strength of 3/5 (gray shadow). QEEG curves were derived from moving averages of 3 data points in Figure 3. Values on Y-axis denoted relative effects, with 0 being baseline and 5 being maximal effect.
Figure 5
Figure 5
Persistence of QEEG changes. Statistically significant QEEG changes persisted longer after amobarbital (Amo) injections (black) than after methohexital (Metho) injections (gray), and were more prominent on the ipsilateral (Ipsi) side of injections (closed columns) than on the contralateral (Contra) side (open columns).
Figure 6
Figure 6
Cross-filling effects on QEEG. More prominent aEEG changes were seen 1-4 min after amobarbital (Amo) or 1-2 min after methohexital (Metho) injections in cases with ≥2.5 grade cross-filling (Crossfill) compared to those without prominent cross-filling (NoCrossfill). Data points and error bars represent averages and s.e.m.; * represents significant changes.

References

    1. Abend NS, Gutierrez-Colina A, Zhao H, et al. Interobserver reproducibility of electroencephalogram interpretation in critically ill children. J Clin Neurophysiol. 2011;28:15–19. - PMC - PubMed
    1. Acharya JN, Dinner DS. Use of the intracarotid amobarbital procedure in the evaluation of memory. J Clin Neurophysiol. 1997;14:311–325. - PubMed
    1. Ahern GL, Labiner DM, Talwar D, et al. Quantitative analysis of the electroencephalogram in the intracarotid amobarbital procedure: Ii. Coherence analysis. Journal of clinical neurophysiology: official publication of the American Electroencephalographic Society. 1995;12:285–290. - PubMed
    1. Akman CI, Micic V, Thompson A, et al. Seizure detection using digital trend analysis: Factors affecting utility. Epilepsy Res. 2011;93:66–72. - PubMed
    1. Balasubramaniam K, Lucas SB, Mawer GE, et al. The kinetics of amylobarbitone metabolism in healthy men and women. British journal of pharmacology. 1970;39:564–572. - PMC - PubMed

Publication types