Review
. 2015:11:361-77.
doi: 10.1146/annurev-clinpsy-032814-112753. Epub 2015 Jan 2.

fMRI functional connectivity applied to adolescent neurodevelopment

Affiliations
Review

fMRI functional connectivity applied to adolescent neurodevelopment

Monique Ernst et al. Annu Rev Clin Psychol. 2015.

Abstract

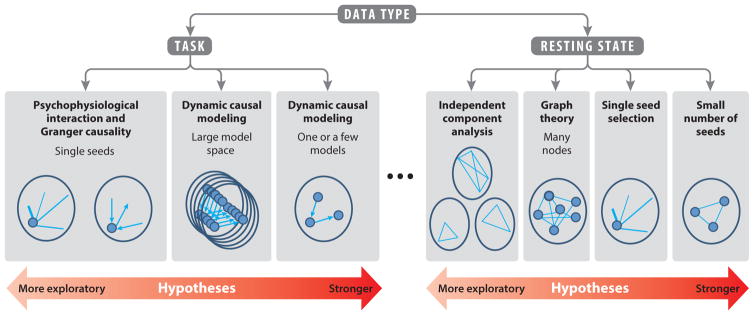
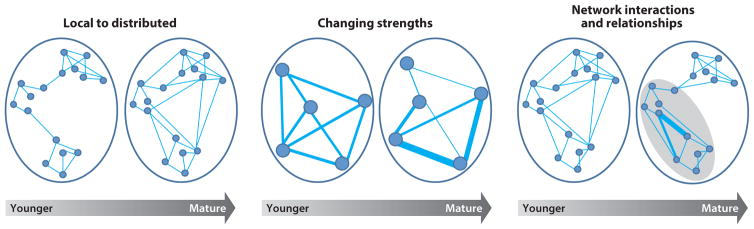
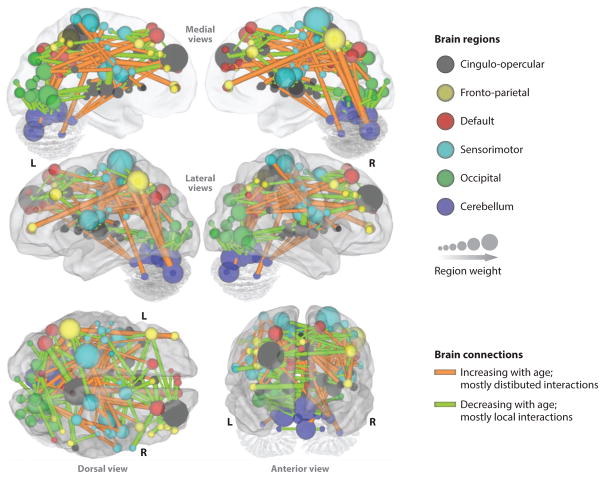
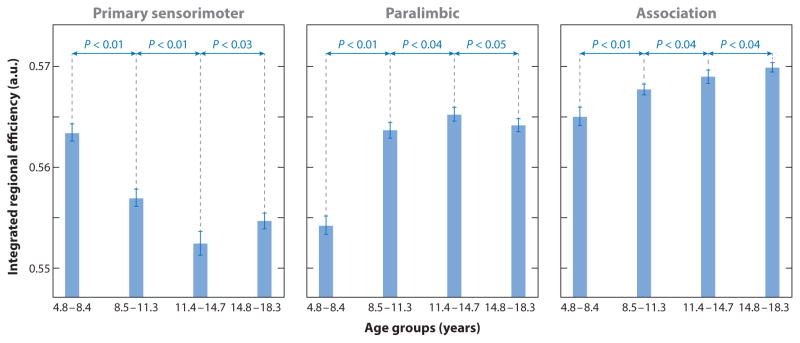
The exponential rise in the number of functional brain connectivity studies, particularly those examining intrinsic functional connectivity (iFC) at rest, and the promises of this work for unraveling the ontogeny of functional neural systems motivate this review. Shortly before this explosion in functional connectivity research, developmental neuroscientists had proposed theories based on neural systems models to explain behavioral changes, particularly in adolescence. The current review presents recent advances in imaging in brain connectivity research, which provides a unique tool for the study of neural systems. Understanding the potential of neuroimaging for refining neurodevelopmental models of brain function requires a description of various functional connectivity approaches. In this review, we describe task-based and resting-state functional magnetic resonance imaging (fMRI) analytic strategies, but we focus on iFC findings from resting-state data to describe general developmental trajectories of brain network organization. Finally, we use the example of drug addiction to frame a discussion of psychopathology that emerges in adolescence.

Keywords: development; fMRI; intrinsic functional connectivity; networks; resting state.


Figures

Figure 1
Figure 1
A heuristic organization of popular functional magnetic resonance imaging (fMRI)-based connectivity methods. A gradient between fully data-driven, exploratory analyses and very strongly hypothesis-driven analyses is proposed. Small filled circles indicate functionally or anatomically defined nodes. Light blue lines represent functional connectivity, and arrows represent effective connectivity. Lines and arrows not pointing to nodes indicate whole-brain, voxel-wise analyses. Ellipsis indicates the as-yet not fully understood relation between task and rest.
Figure 2
Figure 2
Graphic representations of the three types of ontogenic changes in functional neural connectivity described in the text. Networks grouped within the gray oval (last graph on right) represent a hierarchical grouping separate from the other network.
Figure 3
Figure 3
A representation depicting the age-related changes in connections between brain regions on a surface rendering of the brain. Connections that increase with age are shown in orange; those that decrease with age are shown in green. The local interactions between brain regions seem to decrease ( green) with age, whereas a more distributed organization (orange) emerges with age. Also shown are the relative weights of various brain regions (160 ROIs), quantified by the weights of afferent and efferent connections of each region. The color-coding of these regions is based on six resting-state networks (e.g., cingulo-opercular in gray). Figure adapted from Dosenbach et al. (2010) and used with permission from the American Association for the Advancement of Science.
Figure 4
Figure 4
Age-related differences in regional efficiency in three structural brain networks among four age groups (group 1, 4.8–8.4 years; group 2, 8.5–11.3 years; group 3, 11.4–14.7 years; group 4, 14.8–18.3 years) from a graph theory analysis of 203 individuals. Different developmental patterns of maturation (indexed by efficiency) among the three networks are depicted (e.g., the primary sensorimotor network evidences early maturation in the youngest group, whereas the association network in this group shows a protracted development). Figure adapted from Khundrakpam et al. (2013) and used with permission from Oxford University Press.

References

    1. Adkins D. When is puberty too early? Durham, NC: Duke Univ. Health Syst; 2013. http://www.dukemedicine.org/blog/when-puberty-too-early.
    1. Anderson JS, Ferguson MA, Lopez-Larson M, Yurgelun-Todd D. Connectivity gradients between the default mode and attention control networks. Brain Connectivity. 2011;1:147–57. - PMC - PubMed
    1. Angold A, Costello EJ. Puberty and depression. Child Adolesc Psychiatr Clin N Am. 2006;15:919–37. - PubMed
    1. Arnett JJ. Adolescent storm and stress, reconsidered. Am Psychol. 1999;54:317–26. - PubMed
    1. Barnes A, Bullmore ET, Suckling J. Endogenous human brain dynamics recover slowly following cognitive effort. PLOS ONE. 2009;4:e6626. - PMC - PubMed

LinkOut - more resources