

A high-throughput ChIP-Seq for large-scale chromatin studies
- PMID: 25583149
- PMCID: PMC4332152
- DOI: 10.15252/msb.20145776
A high-throughput ChIP-Seq for large-scale chromatin studies
Abstract
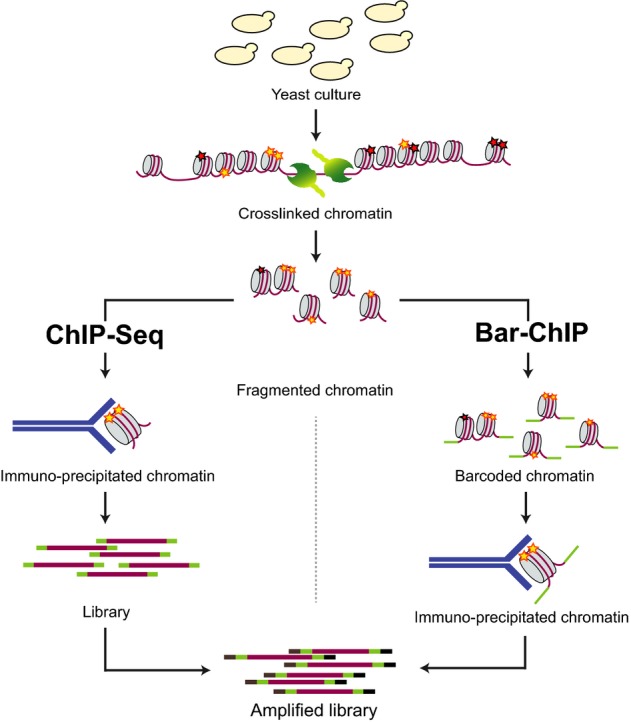
We present a modified approach of chromatin immuno-precipitation followed by sequencing (ChIP-Seq), which relies on the direct ligation of molecular barcodes to chromatin fragments, thereby permitting experimental scale-up. With Bar-ChIP now enabling the concurrent profiling of multiple DNA-protein interactions, we report the simultaneous generation of 90 ChIP-Seq datasets without any robotic instrumentation. We demonstrate that application of Bar-ChIP to a panel of Saccharomyces cerevisiae chromatin-associated mutants provides a rapid and accurate genome-wide overview of their chromatin status. Additionally, we validate the utility of this technology to derive novel biological insights by identifying a role for the Rpd3S complex in maintaining H3K14 hypo-acetylation in gene bodies. We also report an association between the presence of intragenic H3K4 tri-methylation and the emergence of cryptic transcription in a Set2 mutant. Finally, we uncover a crosstalk between H3K14 acetylation and H3K4 methylation in this mutant. These results show that Bar-ChIP enables biological discovery through rapid chromatin profiling at single-nucleosome resolution for various conditions and protein modifications at once.
Keywords: ChIP‐Seq; chromatin; high‐throughput; histone marks; histone methyltransferase.
© 2015 The Authors. Published under the terms of the CC BY 4.0 license.
Figures
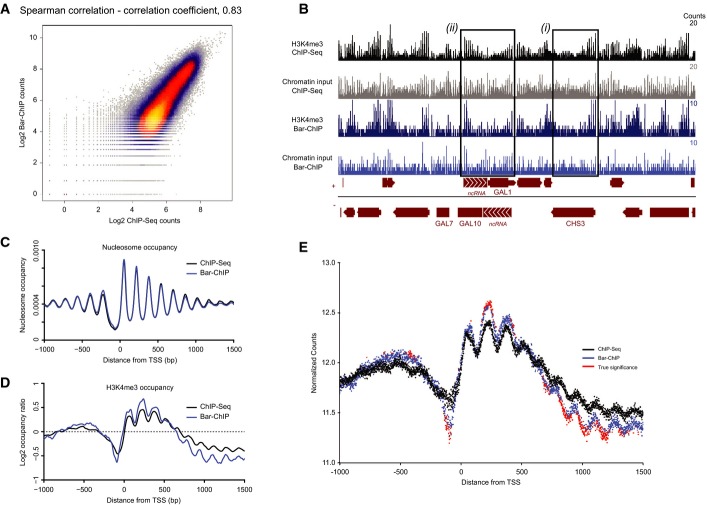
Scatterplot illustrating the correlation between reads counts in the Bar-ChIP and ChIP-Seq datasets obtained for the same biological sample. 100 bp bins were used to compute these counts.
Snapshot of coverage tracks of H3K4me3 around the GAL10 locus obtained using ChIP-Seq and Bar-ChIP protocols. Tracks corresponding to the associated chromatin inputs are also displayed. For a highly expressed gene such as CHS3 (black box (i)), H3K4me3 signal is much stronger at the 5′ end of the gene as compared to the input signal, which spreads along the entire gene body. On the other hand, while input signals display a rather homogeneous nucleosome spread on the GAL1 and GAL10 genes, H3K4me3 immuno-precipitation clearly shows an enrichment of the mark to the 3′ end of the gene (black box (ii)). This corresponds to the presence of actively transcribed antisense non-coding RNAs over the GAL10 and GAL1 genes that are responsible for the inhibition of GAL expression in dextrose-rich medium. Bedgraph format displaying the number of counts per base pair.
TSS plot representing nucleosome occupancy around the TSS of annotated genes as observed in the chromatin input of both ChIP-Seq and Bar-ChIP methods. Occupancy levels are plotted as a function of the distance to the TSS. Midpoint of a nucleosome was approximated as being the center of the genomic locus intercepted by a read pair. Nucleosome counts were determined at each position around annotated TSS and estimated across all genes. Resulting counts were divided by the total number of observed nucleosomes to provide the genome-wide distribution of nucleosomes and occupancy at each position around the TSS.
TSS plot representing H3K4me3 occupancy (normalized by chromatin input) around the TSS of annotated genes as observed in the ChIP-Seq and Bar-ChIP datasets.
Evaluation of H3K4me3 counts with statistically significant difference between ChIP-Seq and Bar-ChIP. The mean normalized counts across all biological replicates are plotted as a function of the distance to the annotated TSS. Differential counts with statistical significance are indicated in red. Significant differences were called with the DESeq2 package after computing local FDR values based on the DESeq2 P-values. Only the positions with a log2 fold change greater than 0.05 and a local FDR smaller than 0.2 were considered significant.
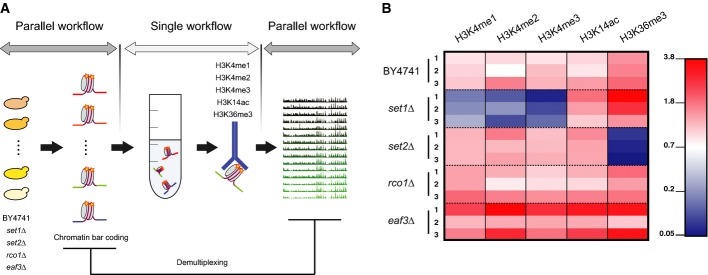
Schematic representation of the experimental design. Cultures corresponding to distinct yeast strains were harvested, crosslinked and their MNase-treated chromatin was barcoded to enable sample tracking. Aliquots from each of the barcoded chromatin samples were pooled together prior to immuno-precipitation against the histone modifications of interest. DNA recovered from each IP was amplified and sequenced using paired-end technology. Finally, barcode sequences were used to demultiplex sequencing datasets and attribute each read to the proper biological sample.
Normalized proportion of reads attributed to each strain. One sequencing lane corresponded to multiplexed samples submitted to one IP assay. For each sequencing lane, read counts attributed to each biological sample were first divided by the total number of reads recovered from the lane (Supplementary Fig. S6). For each biological sample, the resulting ratio was normalized using the proportion of reads in the chromatin input lane that was attributed to that biological sample to correct for biases in the initial pooling of fragmented chromatin samples. Note that each set1Δ library represents less than 0.17% of the total number of reads recovered for the IPs against H3K4 methylation while the set2Δ libraries represent not more than 0.8% of the total reads recovered for the IP against H3K36me3. Absolute numbers for recovered sequencing reads are indicated in Supplementary Fig. S7.
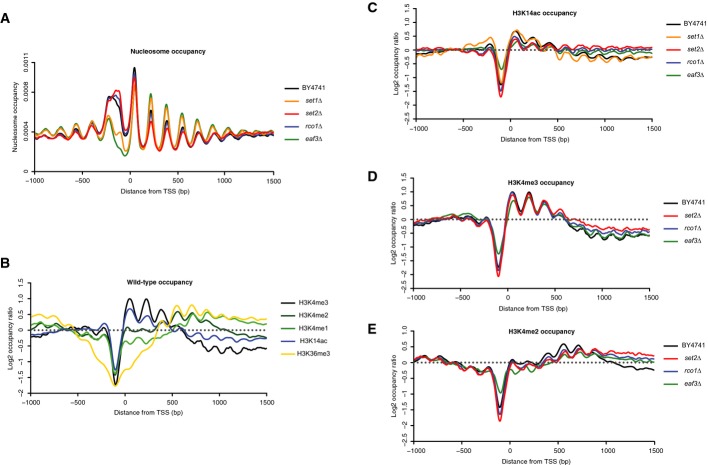
Nucleosome occupancy around annotated TSS for the wild-type and mutant yeast strains profiled in the study.
Occupancy of the various marks profiled in the experiment in the wild-type strain BY4741.
H3K14ac (C), H3K4me3 (D) and H3K4me2 (E) occupancies around the annotated TSS in the mutants profiled in the study.
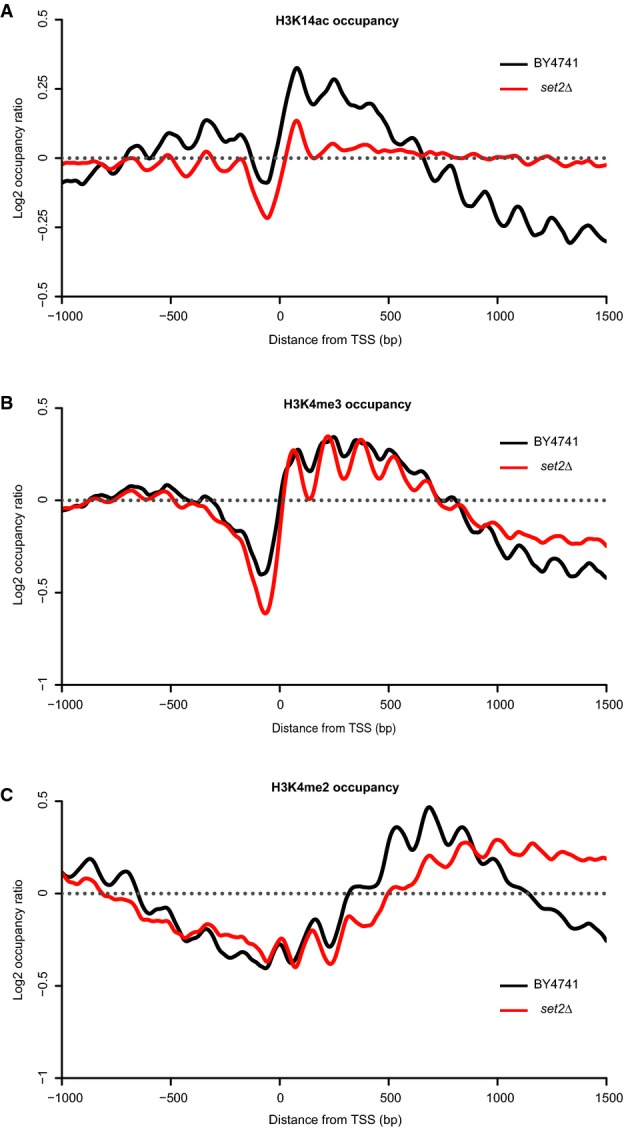
H3K14ac (A), H3K4me3 (B) and H3K4me2 (C) occupancies in the wild-type strain and in the set2Δ mutant. Occupancies were normalized using counts from the chromatin inputs.
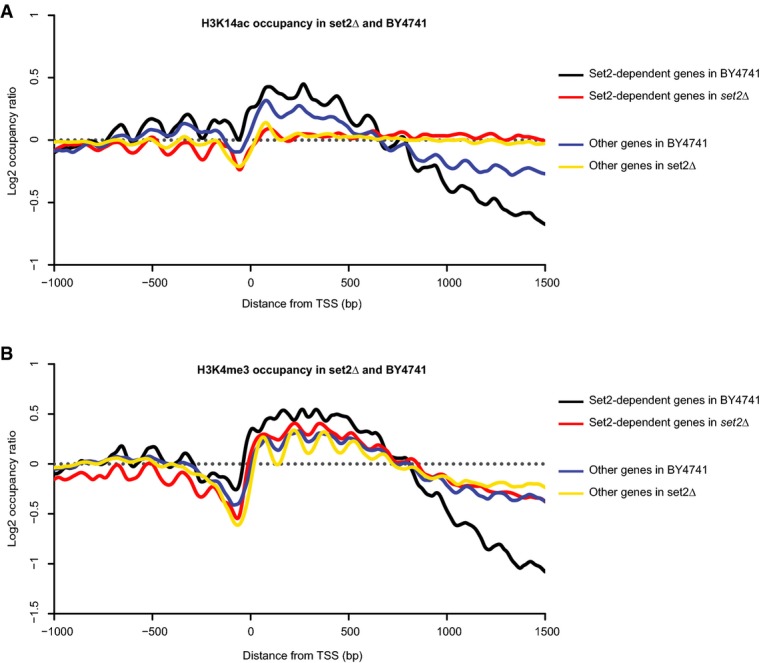
H3K14ac occupancies around the annotated TSS in two groups of genes in the BY4741 and set2Δ strains. Set2-dependent genes were identified using unambiguous genome-wide mapping of internal transcription start sites.
H3K4me3 occupancies around the annotated TSS in two groups of genes in the BY4741 and set2Δ strains.
References
-
- Carrozza MJ, Li B, Florens L, Suganuma T, Swanson SK, Lee KK, Shia W-J, Anderson S, Yates J, Washburn MP, Workman JL. Histone H3 methylation by Set2 directs deacetylation of coding regions by Rpd3S to suppress spurious intragenic transcription. Cell. 2005;123:581–592. - PubMed
Publication types
MeSH terms
Substances
LinkOut - more resources
Full Text Sources
Other Literature Sources
Molecular Biology Databases
