. 2015 Jan 13;17(1):5.
doi: 10.1186/s13058-014-0512-9.

BRCA1-IRIS inactivation overcomes paclitaxel resistance in triple negative breast cancers

Affiliations

BRCA1-IRIS inactivation overcomes paclitaxel resistance in triple negative breast cancers

Zannel Blanchard et al. Breast Cancer Res. .

Abstract

Introduction: Intrinsic or acquired chemoresistance is a major problem in oncology. Although highly responsive to chemotherapies such as paclitaxel, most triple negative breast cancer (TNBC) patients develop chemoresistance. Here we investigate the role of BRCA1-IRIS as a novel treatment target for TNBCs and their paclitaxel-resistant recurrences.

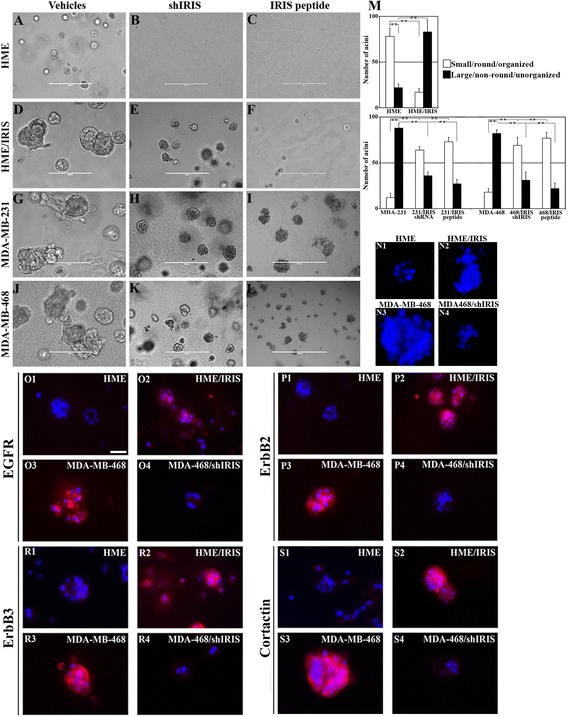
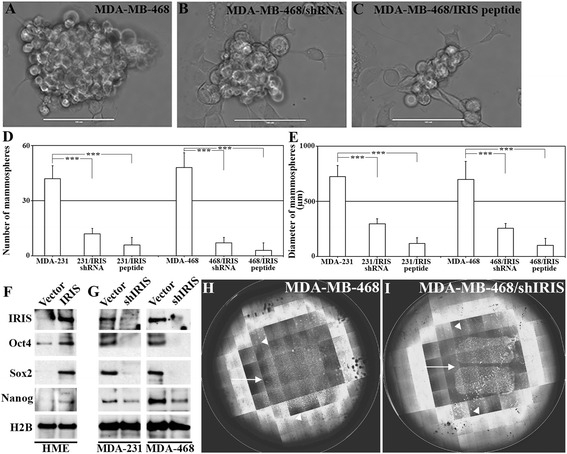
Methods: We analyzed the response of BRCA1-IRIS overexpressing normal mammary cells or established TNBC cells silenced from BRCA1-IRIS to paclitaxel in vitro and in vivo. We analyzed BRCA1-IRIS downstream signaling pathways in relation to paclitaxel treatment. We also analyzed a large cohort of breast tumor samples for BRCA1-IRIS, Forkhead box class O3a (FOXO3a) and survivin expression. Finally, we analyzed the effect of BRCA1-IRIS silencing or inactivation on TNBCs formation, maintenance and response to paclitaxel in an orthotopic model.

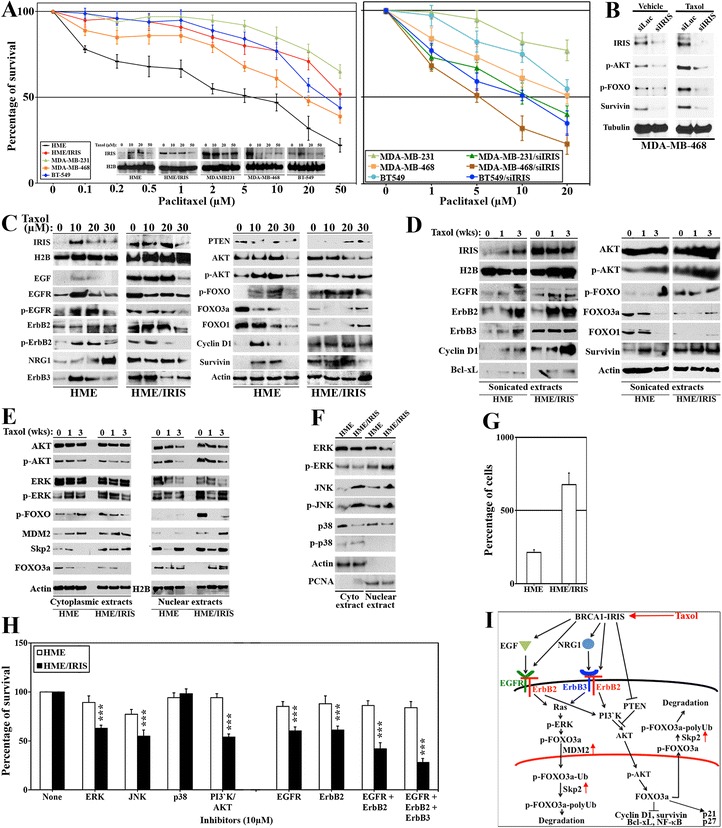
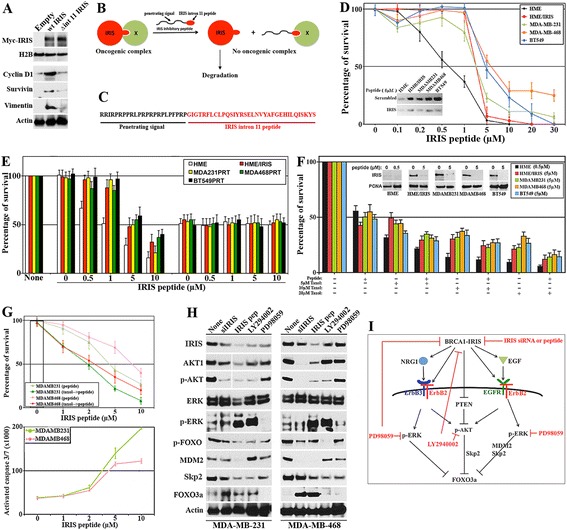
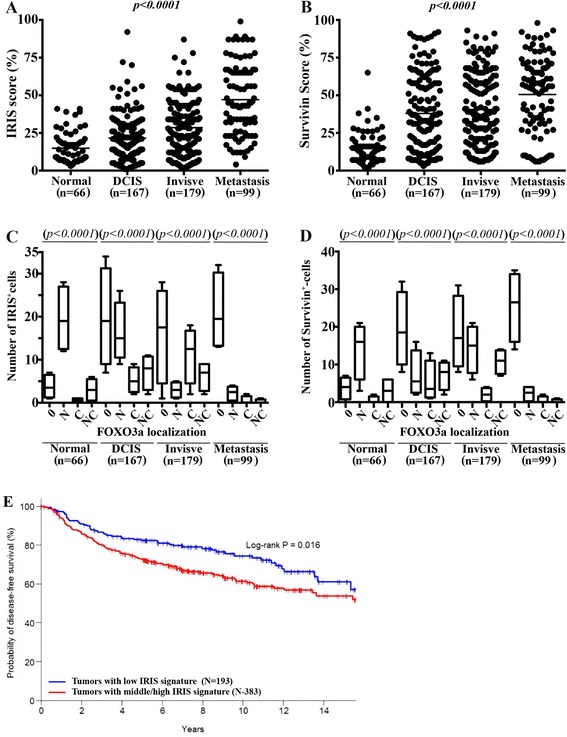
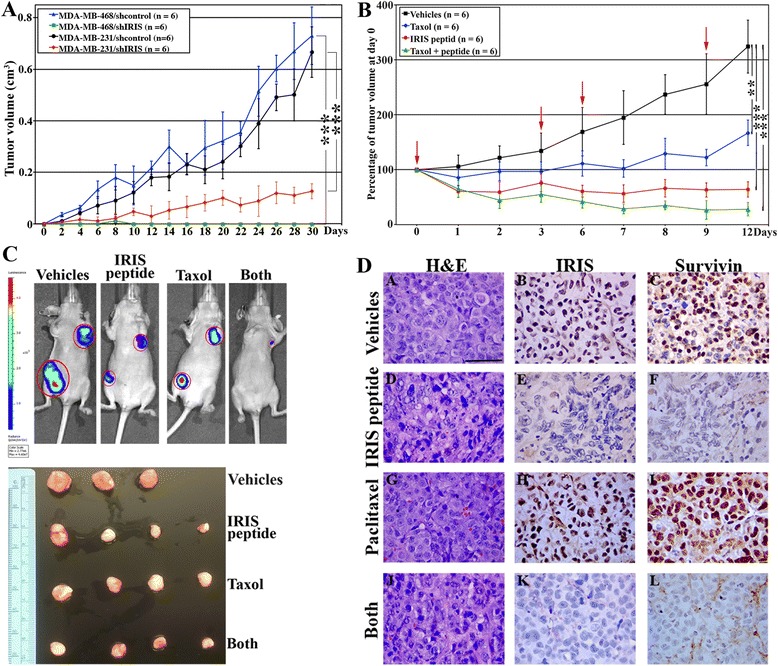
Results: We show that low concentrations of paclitaxel triggers BRCA1-IRIS expression in vitro and in vivo, and that BRCA1-IRIS activates two autocrine signaling loops (epidermal growth factor (EGF)/EGF receptor 1 (EGFR)-EGF receptor 2 (ErbB2) and neurogulin 1 (NRG1)/ErbB2-EGF receptor 3 (ErbB3), which enhances protein kinase B (AKT) and thus survivin expression/activation through promoting FOXO3a degradation. This signaling pathway is intact in TNBCs endogenously overexpressing BRCA1-IRIS. These events trigger the intrinsic and acquired paclitaxel resistance phenotype known for BRCA1-IRIS-overexpressing TNBCs. Inactivating BRCA1-IRIS signaling using a novel inhibitory mimetic peptide inactivates these autocrine loops, AKT and survivin activity/expression, in part by restoring FOXO3a expression, and sensitizes TNBC cells to low paclitaxel concentrations in vitro and in vivo. Finally, we show BRCA1-IRIS and survivin overexpression is correlated with lack of FOXO3a expression in a large cohort of primary tumor samples, and that BRCA1-IRIS overexpression-induced signature is associated with decreased disease free survival in heavily treated estrogen receptor alpha-negative patients.

Conclusions: In addition to driving TNBC tumor formation, BRCA1-IRIS overexpression drives their intrinsic and acquired paclitaxel resistance, partly by activating autocrine signaling loops EGF/EGFR-ErbB2 and NRG1/ErbB2-ErbB3. These loops activate AKT, causing FOXO3a degradation and survivin overexpression. Taken together, this underscores the need for BRCA1-IRIS-specific therapy and strongly suggests that BRCA1-IRIS and/or signaling loops activated by it could be rational therapeutic targets for advanced TNBCs.


Figures

Figure 1
Figure 1
BRCA1-IRIS overexpression promotes intrinsic and acquired paclitaxel resistance in TNBC cells. (A) The survival of HME, HME/IRIS and the indicated TNBC cell lines following treatment with increasing concentrations of paclitaxel. Values are means of triplicates done three separate times. Inset shows BRCA1-IRIS expression in these cell lines following exposure to increasing concentrations of paclitaxel. (B) The expression of the indicated proteins following treatment with vehicle or paclitaxel (5 μM) for 24 h or MDA-MB-468 previously silenced from luciferase or BRCA1-IRIS for 48 h. (C) The expression of the indicated proteins in HME or HME/IRIS cells following exposure to 0, 10, 20 or 30 μM of paclitaxel. (D) The expression of the indicated proteins in HME or HME/IRIS cells following exposure to 1 μM of paclitaxel for 0, 1 or 3 weeks. (E and F) The expression of the indicated proteins in the nucleus or cytoplasm of HME or HME/IRIS following exposure to 1 μM of paclitaxel for 0, 1 or 3 weeks. Activated ERK, JNK and p38 were detected using antibodies specifically detect p-T202/Y204-ERK, p-T183/Y185-JNK, and p-T180/Y182-p38. (G) The effect of BRCA1-IRIS overexpression on the proliferation of HME cells. (H) The effect of inhibiting ERK (using PD98059), JNK (using SP600125), p38 (using SB203580), PI3′K/AKT (using LY294002), EGFR (using Erlotinib), ErbB2 (using CP-724714), EGFR/ErbB2 (using Lapatinib), and EGFR/ErbB2/ErbB3 (using Sapitinib) on the survival of HME or HME/IRIS cells. Values represent the means of experiments that were performed in triplicate done three separate times, *** = P ≤0.001 (compared to control in each cell line). (I) Schematic representation of the data so far. EGFR, ErbB2 and ErbB3, epidermal growth factor receptor 1, 2 and 3, respectively; HME, human mammary epithelial cells; TNBC, triple negative breast cancer.
Figure 2
Figure 2
BRCA1-IRIS inhibitory peptide effect on TNBC cells survival, in vitro . (A) Expression of indicated proteins in HME cells transfected with empty vector, Myc-tagged wild-type BRCA1-IRIS (wt IRIS) or Myc-tagged mutant BRCA1-IRIS (missing the intron 11 domain, Δint 11 IRIS) for 48 h. (B) Schematic representation of the proposed function of BRCA1-IRIS intron 11 domain and peptide. (C) BRCA1-IRIS inhibitory peptide; black sequence is penetrating signal and red sequence is BRCA1-IRIS intron 11 domain. (D) Survival of the indicated cells exposed to increasing concentrations of IRIS peptide. Values are means of triplicates done three separate times. Inset: effect of 5 μM of scrambled or IRIS peptide on BRCA1-IRIS expression in the indicated cell lines. (E) Effect of increasing concentrations of IRIS peptide on the indicated cell lines following luciferase or BRCA1-IRIS silencing. Values are means of triplicates done three separate times. (F) The synergistic effect between IRIS peptide (5 μM) in the indicated TNBC cell lines and 0, 5, 10 and 20 μM of paclitaxel. Values are means of triplicates done three separate times. Inset: effect of 0.5 μM (HME) or 5 μM (other cell lines) of IRIS peptide on BRCA1-IRIS expression. (G, upper) Effect of paclitaxel at 1 μM alone (white bar), increasing concentrations of IRIS peptide alone (light-colored lines) or the combination (dark-colored lines) on the survival of indicated cells. Values are means of triplicates done three separate times. (G, lower) The gradual increase in activated caspase 3/7 in the indicated cells following exposure to increasing concentrations of IRIS peptide. Values are means of triplicates done three separate times. (H) The expression of the indicated proteins in MDA-MB-231 and MDA-MB-468 cells following transfection of BRCA1-IRIS siRNA, or the exposure to 5 μM IRIS peptide, 10 μM of PI3′K/AKT inhibitor (LY294002) or ERK1/2 inhibitor (PD98059). (I) Schematic representation of the data in Figure 2. HME, human mammary epithelial cells; TNBC, triple negative breast cancer.
Figure 3
Figure 3
BRCA1-IRIS overexpression promotes aggressiveness in HME cells, while inactivation inhibits it in TNBC cells. Representative images showing acini formation in low growth factor matrigel-coated wells in the presence of vehicle, shIRIS or IRIS peptide in HME (A-C) HME/IRIS (D-F) MDA-MB-231 (G-I) and MDA-MB-468 (J-L) cell lines at day 10. IRIS peptide was added at 0.5 μM (HME) or 5 μM (the other cell lines). Scale bar in A-L = 400 μm. (M) Quantitative analysis of the number and phenotype of acini formed using HME and HME/IRIS (upper) or MDA-MB-231 and MDA-MB-468 (lower) following the above mentioned treatments at day 10. (N1-N4) Acini formed by HME, HME/IRIS, MDA-MB-468 and MDA-MB-468/shIRIS, respectively. The expression of the indicated proteins in acini formed using HME (O1, P1, R1 and S1), HME/IRIS (O2, P2, R2 and S2), MDA-MB-468 (O3, P3, R3 and S3) and MDA-MB-468/shIRIS (O4, P4, R4 and S4) cells. Scale bar in O1-S4 = 100 μm. HME, human mammary epithelial cells; TNBC, triple negative breast cancer.
Figure 4
Figure 4
BRCA1-IRIS overexpression promotes tumor-initiating phenotype in HME cells, while inactivation suppresses it in TNBC cells. (A-C) Representative images showing mammosphere formation in MDA-MB-468 cells following control treatments (A), BRCA1-IRIS silencing (B) or inactivation using IRIS peptide (C) at day 10. Scale bar in A-C = 1,000 μm. Quantitative analysis of the number (E) or diameter (F) of mammospheres developed using MDA-MB-231 or MDA-Mb-468 cells after vehicles, BRCA1-IRIS silencing or BRCA1-IRIS inactivation using IRIS peptide. (G) The expression of the indicted stemness biomarkers in HME or BRCA1-IRIS overexpressing HME cells or MDA-MB-231 and MDA-MB468 expressing or silenced from BRCA1-IRIS. Representative images of the migration of MDA-MB-468 (H) or MDA-MB-468 expressing IRIS shRNA (I). In both images arrows show intervening spaces left by the insert that were filled by MDA-MB-468 (24 h later) and not in BRCA1-IRIS-silenced MD-MB-468 and in both images arrowheads show the distance MDA-MB-468 cells travelled outward and the lack of such migration in BRCA1-IRIS-silenced MDA-MB-468 cells. HME, human mammary epithelial cells; TNBC, triple negative breast cancer.
Figure 5
Figure 5
BRCA1-IRIS overexpression promotes EMT and invasion in HME cells, while inactivation suppresses them in TNBC cells. (A) Representative images showing the invasion ability of MDA-MB-231 (A and H) and MDA-MB-468 (D and K) cells through matrigel-coated Boyden chambers and the significant retardation of this invasion ability following BRCA1-IRIS silencing in MDA-MB-231 (B and I) and MDA-MB-468 (E and L) or BRCA1-IRIS inactivation using IRIS peptide in MDA-MB-231 (C and J) and MDA-MB-468 (F and M) cells on day 7. Scale bars in A-F and H-M = 1,000 μm. Quantitative analysis of invasive ability of the indicated cells shown as cells travelled to the other side of the transwells (G) or jumped to the lower well of the Boyden chamber (N). (O) The expression of the indicated EMT biomarkers in HME or BRCA1-IRIS overexpressing HME cells as well as MDA-MB-231 or MDA-MB-468 cells expressing or silenced from BRCA1-IRIS. Please note that BRCA1-IRIS and H2B blots used are the same as those used in Figure 4G. The expression of the indicated EMT/invasion biomarkers in HME (P1, Q1, R1, and S1), BRCA1-IRIS-overexpressing HME (P2, Q2, R2 and S2), MDA-MB-468 (P3, Q3, R3 and S3) or MDA-MB-468 silenced from BRCA1-IRIS (P4, Q4, R4 and S4) cells. Scale bars in P1-P4 and S1-S4 = 20 μm, and in Q1-Q4 and R1-R4 = 50 μm. EMT, epithelial to mesenchymal transition; HME, human mammary epithelial cells; TNBC, triple negative breast cancer.
Figure 6
Figure 6
Elevated BRCA1-IRIS and survivin and lack of FOXO3a expression correlates with breast tumors aggressiveness. Paraffin-embedded tissue microarray sections were examined by immunohistochemistry with anti-BRCA1-IRIS, survivin and FOXO3a mAb. (A and B) BRCA1-IRIS and survivin, respectively staining scores in normal (n = 66), DCIS (n = 167), invasive (n = 179) and metastatic (n = 99) breast cancer tissue samples. (C and D) BRCA1-IRIS and survivin, respectively staining scores per field as compared to the localization of FOXO3a in each cell in normal (n = 66), DCIS (n = 167), invasive (n = 179) and metastatic (n = 99) breast cancer tissue samples. (E) Percentage of probability of disease-free survival in patients with TNBC tumors overexpressing low (blue line) vs. middle/high (red line) levels of EGFR/AKT/MDM2/Skp2/survivin as a surrogate for BRCA-IRIS overexpression. DCIS, ductal carcinoma in situ; FOXO3a, Forkhead box class OAKT3a; mAb, monoclonal antibody; TNBC, triple negative breast cancer.
Figure 7
Figure 7
BRCA1-IRIS overexpression promotes TNBC formation and maintenance, while inactivation sensitizes them to low paclitaxel concentrations. (A) Volumes of tumors developed in SCID mice using MDA-MB-231/shcontrol (black line, n = 6), MDA-MB-231/shIRIS (red line, n = 6), MDA-MB-468/shcontrol (blue line, n = 6) or MDA-MB-468/shIRIS (green line, n = 6). (B) The effect of vehicle (black line, n = 6), paclitaxel (10 mg/kg, delivered i.p., blue line, n = 6), IRIS peptide (10 mg/kg, delivered i.t., red line, n = 6), or both (at half the concentrations, delivered through the same routes, green line, n = 6) on an established MDA-MB-468 tumors. Red arrows show the times of the drug administration. ** = P ≤0.001 and *** = P ≤0.0001. (C) Shows representative images of treated mice as described in (B) at day 12 (upper) or representative images of tumors isolated from these mice following the treatments also at day 12 (lower). (D) Representative images of the sections from tumors shown in (B and C) stained with H&E (left), BRCA1-IRIS (middle), survivin (right) antibodies. Scale bar is D = 100 μm. H&E, hematoxylin and eosin; i.p., intraperitoneally; i.t., intratumorally; TNBC, triple negative breast cancer.

References

    1. Ozols RF. Paclitaxel (Taxol)/carboplatin combination chemotherapy in the treatment of advanced ovarian cancer. Semin Oncol. 2000;27:3–7. - PubMed
    1. Kosmas C, Tsavaris NB, Polyzos A, Kalofonos HP, Sepsas E, Malamos NA, et al. A phase II study of paclitaxel-ifosfamide-cisplatin combination in advanced non-small cell lung carcinoma. Cancer. 2000;89:774–782. doi: 10.1002/1097-0142(20000815)89:4<774::AID-CNCR9>3.0.CO;2-5. - DOI - PubMed
    1. De Lena M, Latorre A, Calabrese P, Catino A, Lorusso V, Mazzei A, et al. High efficacy of paclitaxel and doxorubicin as first-line therapy in advanced breast cancer: a phase I-II study. J Chemother. 2000;12:367–373. doi: 10.1179/joc.2000.12.4.367. - DOI - PubMed
    1. Mekhail TM, Markman M. Paclitaxel in cancer therapy. Expert Opin Pharmacother. 2002;3:755–766. doi: 10.1517/14656566.3.6.755. - DOI - PubMed
    1. Jiménez B, Trigo JM, Pajares BI, Sáez MI, Quero C, Navarro V, et al. Efficacy and safety of weekly paclitaxel combined with cetuximab in the treatment of pretreated recurrent/metastatic head and neck cancer patients. Oral Oncol. 2013;49:182–185. doi: 10.1016/j.oraloncology.2012.09.003. - DOI - PubMed

MeSH terms