. 2015 Jan 27;112(4):1119-24.
doi: 10.1073/pnas.1423588112. Epub 2015 Jan 12.

Autophagy-independent functions of UVRAG are essential for peripheral naive T-cell homeostasis

Affiliations

Autophagy-independent functions of UVRAG are essential for peripheral naive T-cell homeostasis

Samia Afzal et al. Proc Natl Acad Sci U S A. .

Abstract

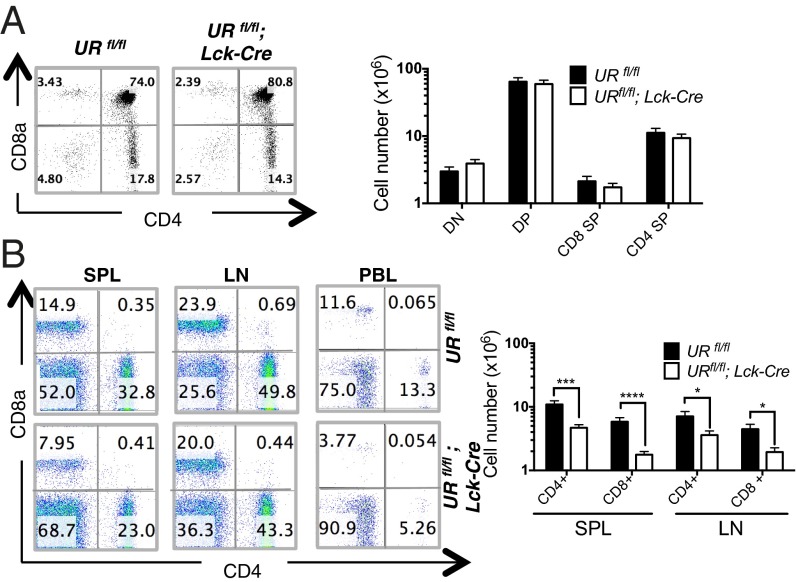
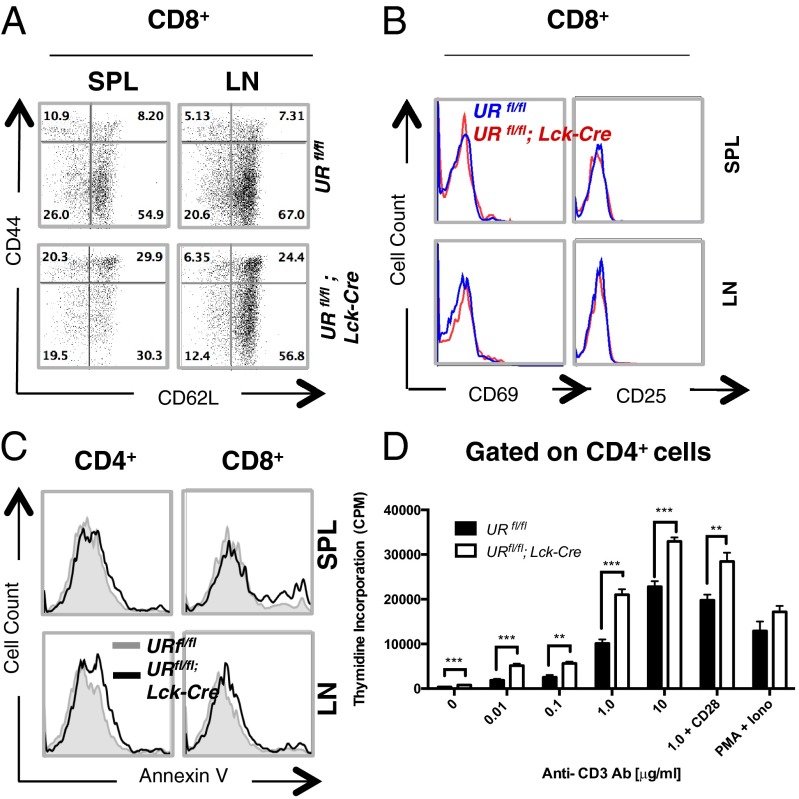
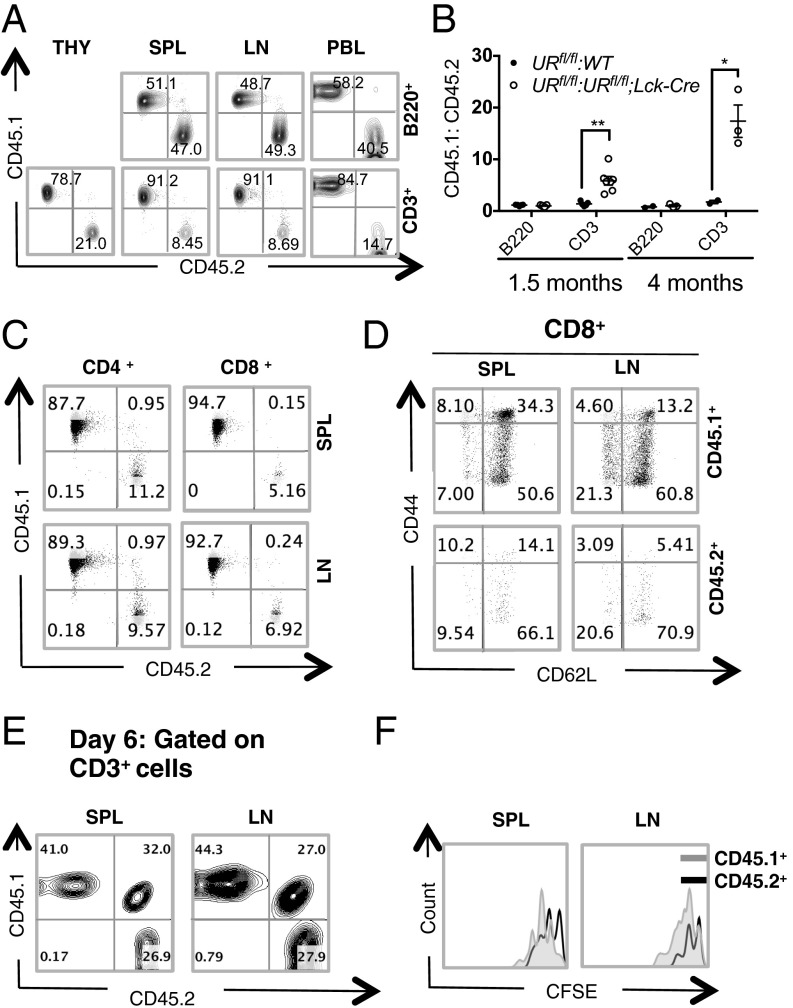
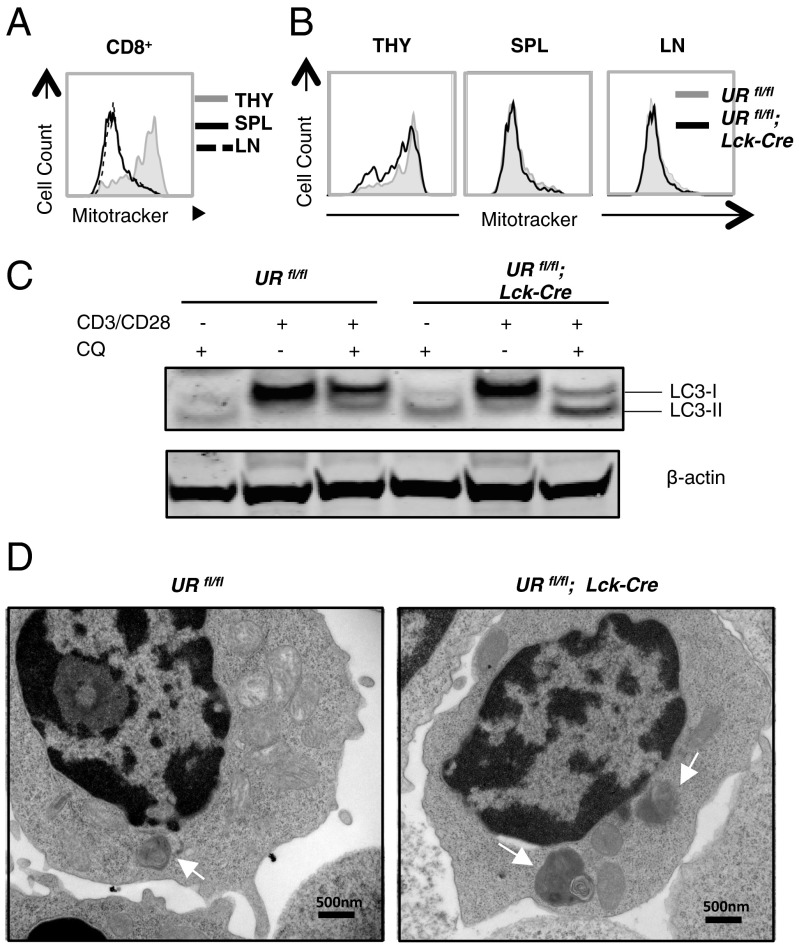
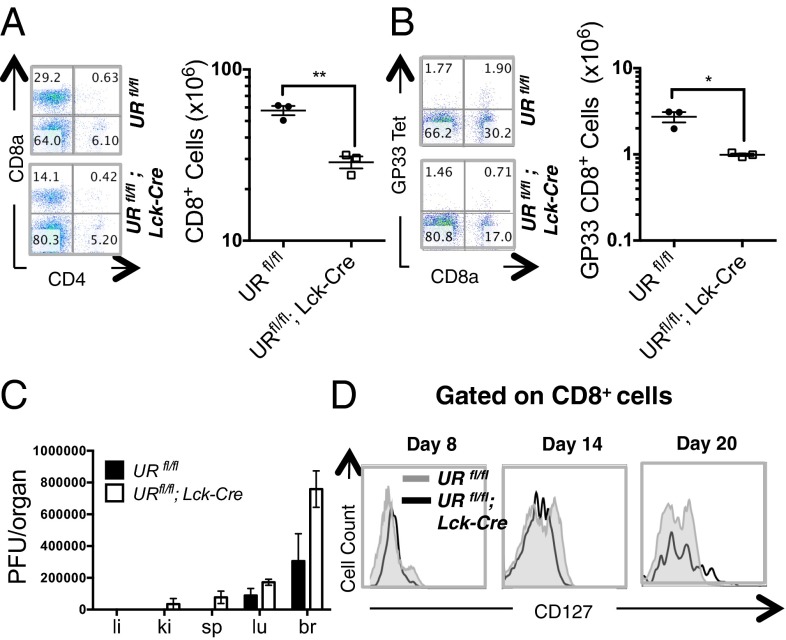
UV radiation resistance-associated gene (UVRAG) encodes a tumor suppressor with putative roles in autophagy, endocytic trafficking, and DNA damage repair but its in vivo role in T cells is unknown. Because conditional homozygous deletion of Uvrag in mice results in early embryonic lethality, we generated T-cell-specific UVRAG-deficient mice that lacked UVRAG expression specifically in T cells. This loss of UVRAG led to defects in peripheral homeostasis that could not be explained by the increased sensitivity to cell death and impaired proliferation observed for other autophagy-related gene knockout mice. Instead, UVRAG-deficient T-cells exhibited normal mitochondrial clearance and activation-induced autophagy, suggesting that UVRAG has an autophagy-independent role that is critical for peripheral naive T-cell homeostatic proliferation. In vivo, T-cell-specific loss of UVRAG dampened CD8(+) T-cell responses to LCMV infection in mice, delayed viral clearance, and impaired memory T-cell generation. Our data provide novel insights into the control of autophagy in T cells and identify UVRAG as a new regulator of naïve peripheral T-cell homeostasis.

Keywords: T-cell homeostasis; UVRAG-deficient mice; autophagy; embryonic lethality.


Conflict of interest statement

The authors declare no conflict of interest.

Figures

Fig. 1.
Fig. 1.
Impaired T-cell homeostasis in the periphery of URfl/fl;Lck-Cre mice. (A) (Left) Flow cytometric analysis of DN, DP and SP thymocytes from URfl/fl and URfl/fl;Lck-Cre mice. Numbers are percentages of total live thymocytes and are representative of four mice per group. (Right) Quantitation of the mean absolute numbers ± SEM of the indicated thymocyte subsets in the thymus of URfl/fl and URflfl;Lck-Cre mice. Results are derived from 13 independent experiments involving 1–4 mice per group. (B) (Left) Flow cytometric analysis of CD4+ and CD8+ T cells isolated from spleen (SPL), lymph node (LN) and peripheral blood (PBL) of URfl/fl and URfl/fl;Lck-Cre mice (n = 13–16 per group). Numbers are percentages of total live lymphocytes. Results are representative of 13 trials. (Right) Quantitation of mean absolute numbers ± SEM of CD4+ and CD8+ T cells in the SPL and LN of URfl/fl and URflfl;Lck-Cre mice (n = 13–16 mice per group). *P < 0.05; ***P < 0.0005; ****P < 0.00005.
Fig. 2.
Fig. 2.
In vitro characterization of marker profile, apoptosis and anti-CD3-stimulated proliferation of UVRAG-deficient T cells. (A) Flow cytometric analysis of CD8+ T cells that were isolated from SPL and LN of littermate URfl/fl and URfl/fl;Lck-Cre mice (n = 1–4 per group) and immunostained to detect CD44 and CD62L. Numbers are percentages of total CD8+ T cells and are representative of eight trials. (B) Flow cytometric plot of CD69 and CD25 expression by the CD8+ T cells in A. Data are representative of six independent experiments involving 1–4 mice per group. (C) Flow cytometric analysis of apoptosis of resting CD4+ or CD8+ T cells that were isolated from SPL or LN of URfl/fl (gray line) or URfl/fl;Lck-Cre (black line) mice (n = 1–4 per group) and stained with Annexin V. Data are representative of three independent experiments. (D) 3H-thymidine incorporation assay of proliferation in vitro of naïve peripheral CD4+ T cells that were isolated from URfl/fl or URfl/fl;Lck-Cre mice (n = 2–4 per group) and stimulated for 72 h in vitro with the indicated concentrations of plate-bound anti-CD3 Ab, or 1.0 µg/mL plate-bound anti-CD3 Ab plus 0.1 µg/mL plate-bound anti-CD28 Ab, or with PMA (10 ng/mL) plus ionomycin (Iono; 100 ng/mL). Data are the cumulative mean cpm ± SEM of triplicates from two independent experiments. **P < 0.005; ***P < 0.0005.
Fig. 3.
Fig. 3.
UVRAG-deficient T cells show defects in bone marrow reconstitution and lymphopenia-induced homeostatic proliferation. (A) Flow cytometric analysis of B and T-cell populations in the indicated lymphoid tissues of mutant BM chimeras. BM cells from CD45.1+ URfl/fl and CD45.2+ URfl/fl;Lck-Cre mice were mixed 1:1 and i.v.-injected into sublethally irradiated Rag-2−/− mice (n = 3–4 mice per group). In control experiments, a 1:1 mixture of BM cells from CD45.1+ URfl/fl and CD45.2+ URfl/fl mice was injected. After 1.5 mo, lymphoid tissue reconstitution was assessed by measuring the relative contributions of CD45.1+ and CD45.2+ BM cells to the regeneration of B (B220+) and T (CD3+) cell populations in thymus (THY), SPL, LN and PBL of chimeric recipients. Numbers are percentages of live B220+ or CD3+ cells. Results are representative of four trials. (B) Quantitation of ratio of CD45.1+ vs. CD45.2+ BM cells contributing to the reconstitution of B- and T-cell populations in PBL of the mice in A at 1.5 mo or 4 mo after reconstitution. Each data point represents a single mouse and horizontal bars are geometric mean values. Data are representative of four independent experiments involving 3–4 mice per group. *P < 0.05; **P < 0.005. (C) Flow cytometric analysis of reconstitution of CD4+ and CD8+ populations in SPL and LN of the mutant chimeras in A. Numbers are percentages of live CD4+ and CD8+ cells. Results are representative of 2 experiments involving 3–5 mice per group. (D) Flow cytometric analysis of CD44 and CD62L expression by live CD8+ T cells from SPL and LN of the mutant chimeras (n = 3) in A. Results are representative of two trials. (E) Flow cytometric analysis of CFSE-labeled URfl/fl (CD45.1+) or URfl/fl;Lck-Cre (CD45.2+) naïve T cells that were transferred into irradiated C57BL/6 (CD45.1/CD45.2) lymphopenic hosts and recovered from SPL and LN 6 d later. Numbers are percentages of live CD3+ T cells that were CD45.1+ or CD45.2+. Results are representative of two trials involving 3–4 mice per group. (F) Flow cytometric plot of CFSE dilution in URfl/fl (CD45.1+) and URfl/fl;Lck-Cre (CD45.2+) T cells among live CD3+ cells isolated from SPL or LN of one recipient in E. Data are representative of two independent experiments.
Fig. 4.
Fig. 4.
Activation-induced autophagy is enhanced in UVRAG-deficient T cells. (A) Flow cytometric plot of mitochondrial content in CD8+ SP thymocytes (THY) or peripheral CD8+ T cells isolated from SPL and LN of steady-state URfl/fl mice (n = 3) and stained with FITC-Mitotracker. Results are representative of three trials. (B) Flow cytometric plot of mitochondrial content of CD8+ T cells isolated from the indicated lymphoid tissues of one URfl/fl and one URfl/fl;Lck-Cre mouse. Data were obtained as in A and are representative of two independent experiments involving 2–3 mice per group. (C) Autophagic flux in T cells that were isolated from SPL and LN of URfl/fl and URfl/fl;Lck-Cre mice (n = 2 per group) and activated in vitro overnight with 2 μg/mL anti-CD3 plus 0.2 μg/mL anti-CD28 Abs, with or without 25 nM chloroquine (CQ). Lysates were immunoblotted to detect LC3I/II. β-actin, loading control. Results are representative of three independent experiments. (D) Transmission electron micrographs showing autophagosomes in naïve peripheral T cells that were isolated from SPL and LN of URfl/fl and URfl/fl;Lck-Cre mice (n = 2 per group) and activated in vitro with anti-CD3/CD28 Abs in the presence of CQ. Scale bars represent 500 nm and autophagosomes are highlighted with white arrowheads. Images are representative of one experiment.
Fig. 5.
Fig. 5.
UVRAG is required for normal responses to acute LCMV infection and MPEC generation. (A) Flow cytometric analysis of CD8+ T cells that were isolated from SPL of 6–8 wk old LCMV-infected URfl/fl and URfl/fl;Lck-Cre mice (n = 3 per group) and examined on day 8 postinjection. (Left) Representative plots of CD4 and CD8 expression. (Right) Quantitation of CD8+ T cells in individual mice. Horizontal lines are the cumulative geometric mean ± SEM **P < 0.005. (B) Flow cytometric analysis of GP33 tetramer-specific CD8+ T cells from the mice in A. Data were analyzed as in A. *P < 0.05. (C) Plate count pfu determinations of viral titres in liver (li), kidney (ki), spleen (sp), lung (lu), and brain (br) of the infected mice in A. Results are the cumulative mean ± SEM (n = 3 per group) and are representative of two independent trials. (D) Flow cytometric plot of CD8+ T cells that were CD127+ among PBL isolated on the indicated days postinfection from the infected mice in A. Results are representative of one trial involving three mice per group.

References

    1. Pua HH, Dzhagalov I, Chuck M, Mizushima N, He YW. A critical role for the autophagy gene Atg5 in T cell survival and proliferation. J Exp Med. 2007;204(1):25–31. - PMC - PubMed
    1. Li C, et al. Autophagy is induced in CD4+ T cells and important for the growth factor-withdrawal cell death. J Immunol. 2006;177(8):5163–5168. - PubMed
    1. Kovacs JR, et al. Autophagy promotes T-cell survival through degradation of proteins of the cell death machinery. Cell Death Differ. 2012;19(1):144–152. - PMC - PubMed
    1. Jia W, He YW. Temporal regulation of intracellular organelle homeostasis in T lymphocytes by autophagy. J Immunol. 2011;186(9):5313–5322. - PubMed
    1. Pua HH, Guo J, Komatsu M, He YW. Autophagy is essential for mitochondrial clearance in mature T lymphocytes. J Immunol. 2009;182(7):4046–4055. - PubMed

Publication types

MeSH terms

Substances