

Recent shifts in the occurrence, cause, and magnitude of animal mass mortality events
- PMID: 25583498
- PMCID: PMC4313809
- DOI: 10.1073/pnas.1414894112
Recent shifts in the occurrence, cause, and magnitude of animal mass mortality events
Abstract
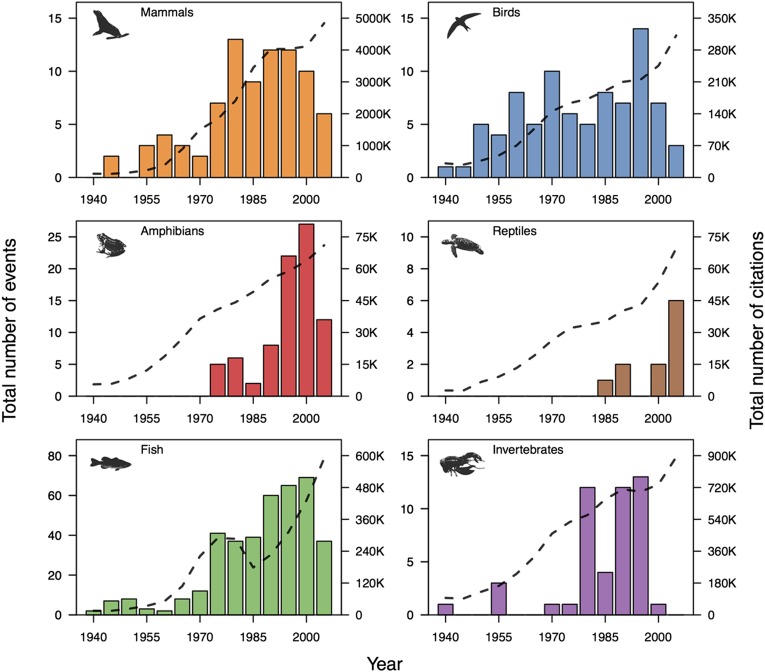
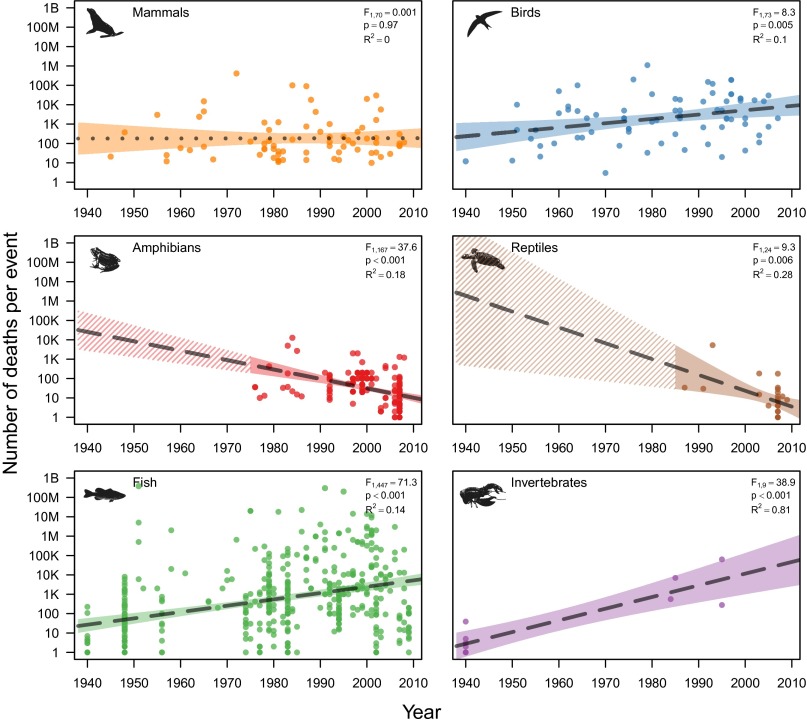
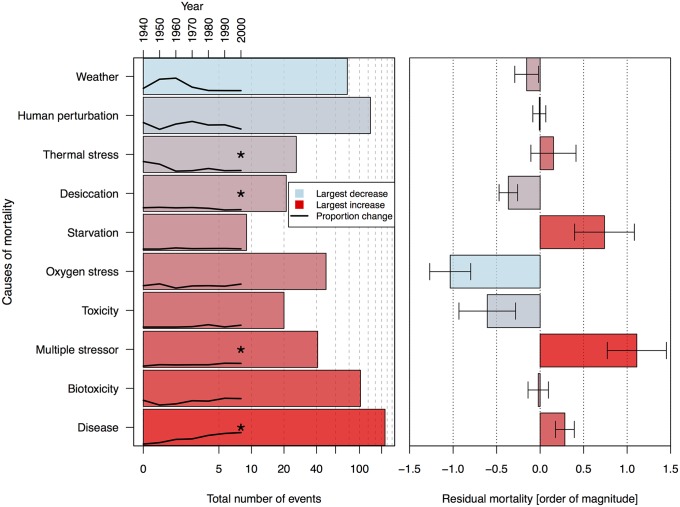
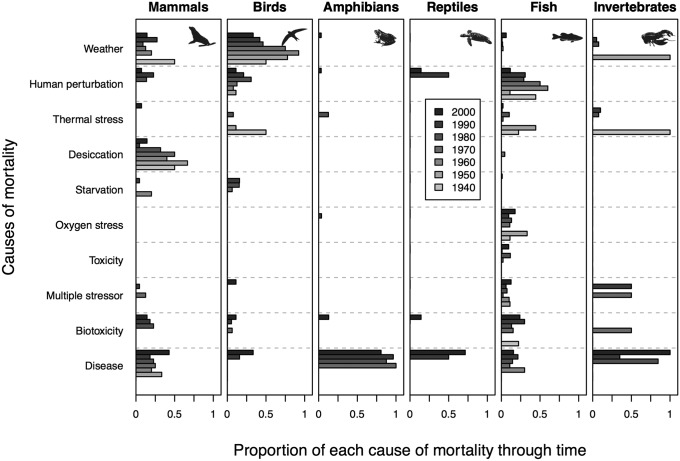
Mass mortality events (MMEs) are rapidly occurring catastrophic demographic events that punctuate background mortality levels. Individual MMEs are staggering in their observed magnitude: removing more than 90% of a population, resulting in the death of more than a billion individuals, or producing 700 million tons of dead biomass in a single event. Despite extensive documentation of individual MMEs, we have no understanding of the major features characterizing the occurrence and magnitude of MMEs, their causes, or trends through time. Thus, no framework exists for contextualizing MMEs in the wake of ongoing global and regional perturbations to natural systems. Here we present an analysis of 727 published MMEs from across the globe, affecting 2,407 animal populations. We show that the magnitude of MMEs has been intensifying for birds, fishes, and marine invertebrates; invariant for mammals; and decreasing for reptiles and amphibians. These shifts in magnitude proved robust when we accounted for an increase in the occurrence of MMEs since 1940. However, it remains unclear whether the increase in the occurrence of MMEs represents a true pattern or simply a perceived increase. Regardless, the increase in MMEs appears to be associated with a rise in disease emergence, biotoxicity, and events produced by multiple interacting stressors, yet temporal trends in MME causes varied among taxa and may be associated with increased detectability. In addition, MMEs with the largest magnitudes were those that resulted from multiple stressors, starvation, and disease. These results advance our understanding of rare demographic processes and their relationship to global and regional perturbations to natural systems.
Keywords: catastrophes; death; defaunation; rare demographic events.
Conflict of interest statement
The authors declare no conflict of interest.
Figures
References
-
- Lande R. Risks of population extinction from demographic and environmental stochasticity and random catastrophes. Am Nat. 1993;142(6):911–927. - PubMed
-
- Reed D, O'Grady J, Ballou J, Frankham R. The frequency and severity of catastrophic die-offs in vertebrates. Anim Conserv. 2003;6:109–114.
-
- Ameca Y Juárez EI, Mace GM, Cowlishaw G, Pettorelli N. Natural population die-offs: Causes and consequences for terrestrial mammals. Trends Ecol Evol. 2012;27(5):272–277. - PubMed
-
- Ceballos G, Ehrlich PR. Mammal population losses and the extinction crisis. Science. 2002;296(5569):904–907. - PubMed
-
- Barnosky AD, et al. Has the Earth’s sixth mass extinction already arrived? Nature. 2011;471(7336):51–57. - PubMed
Publication types
MeSH terms
LinkOut - more resources
Full Text Sources
Other Literature Sources
Molecular Biology Databases
Miscellaneous
