. 2015 Apr;83(4):1235-45.
doi: 10.1128/IAI.01713-14. Epub 2015 Jan 12.

A small molecule, odanacatib, inhibits inflammation and bone loss caused by endodontic disease

Affiliations

A small molecule, odanacatib, inhibits inflammation and bone loss caused by endodontic disease

Liang Hao et al. Infect Immun. 2015 Apr.

Abstract

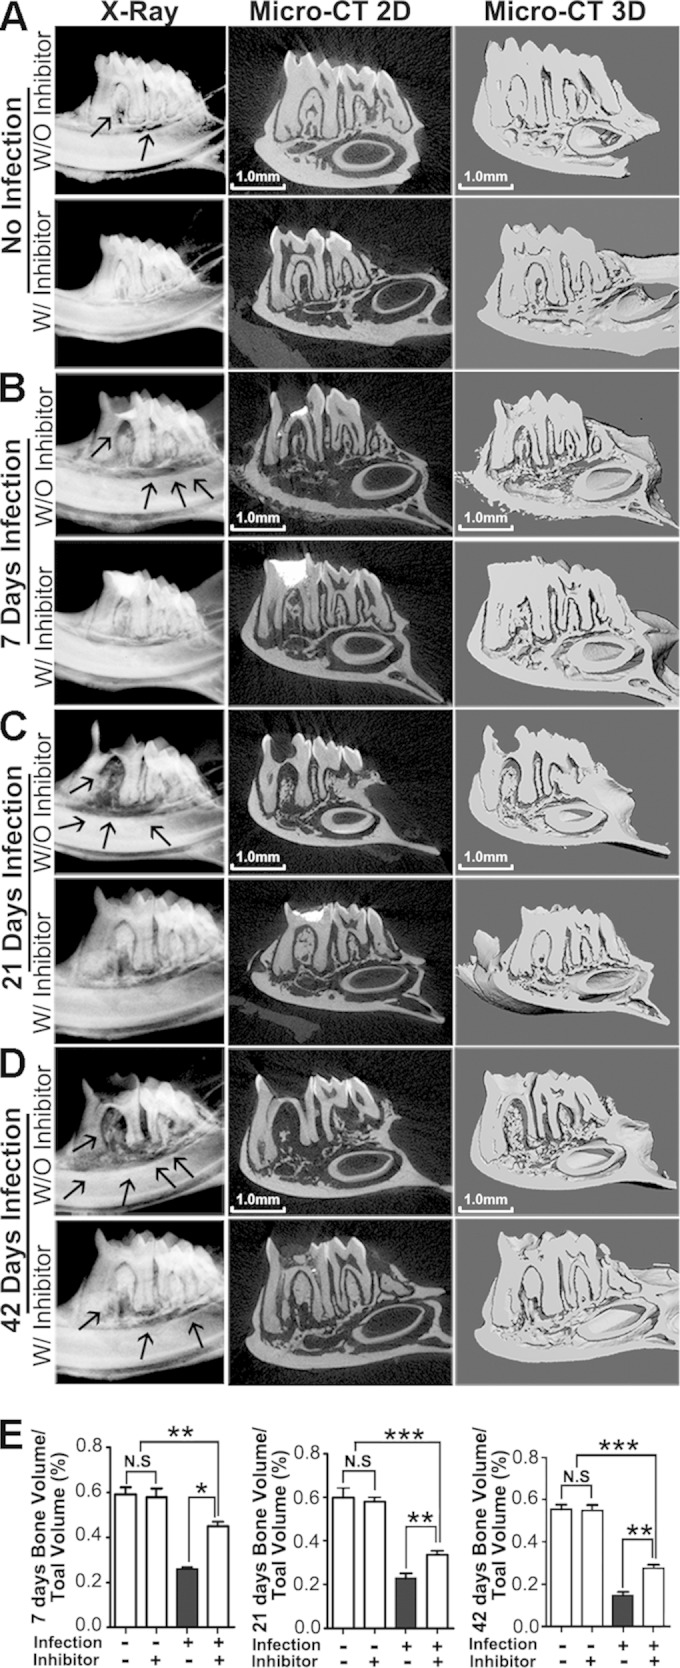
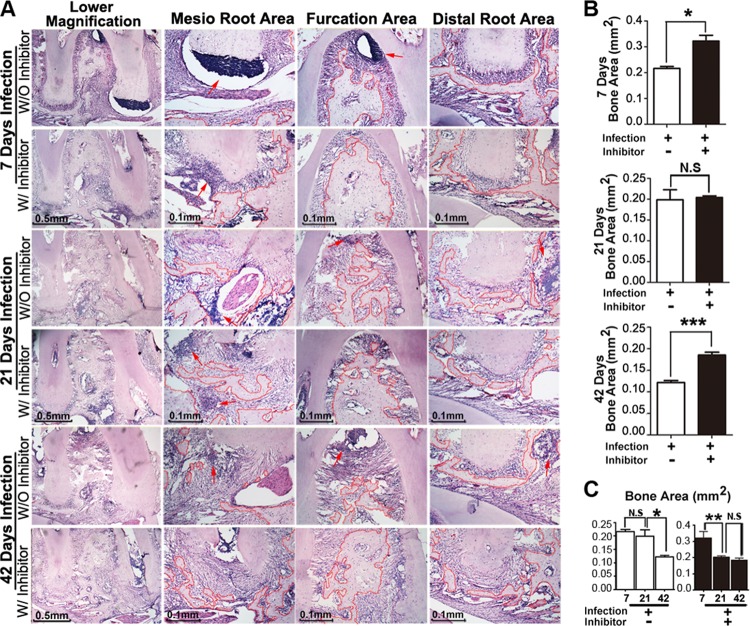
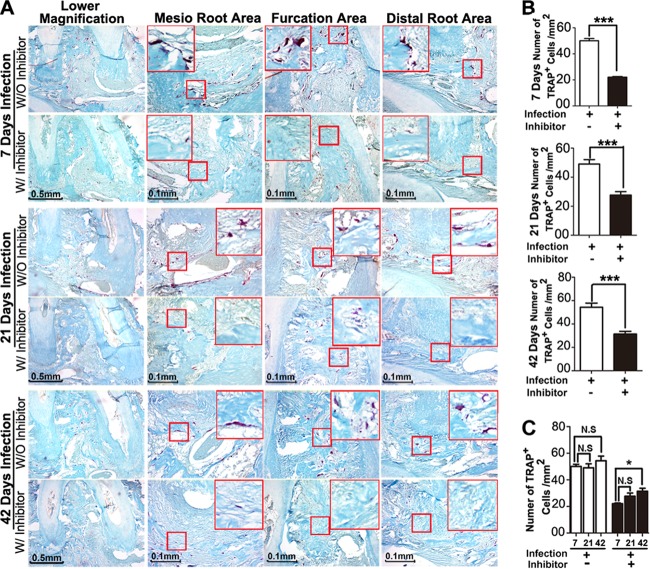
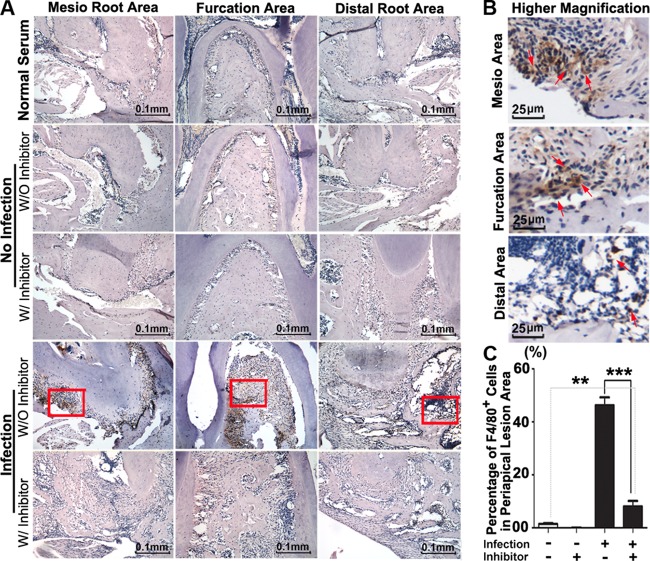
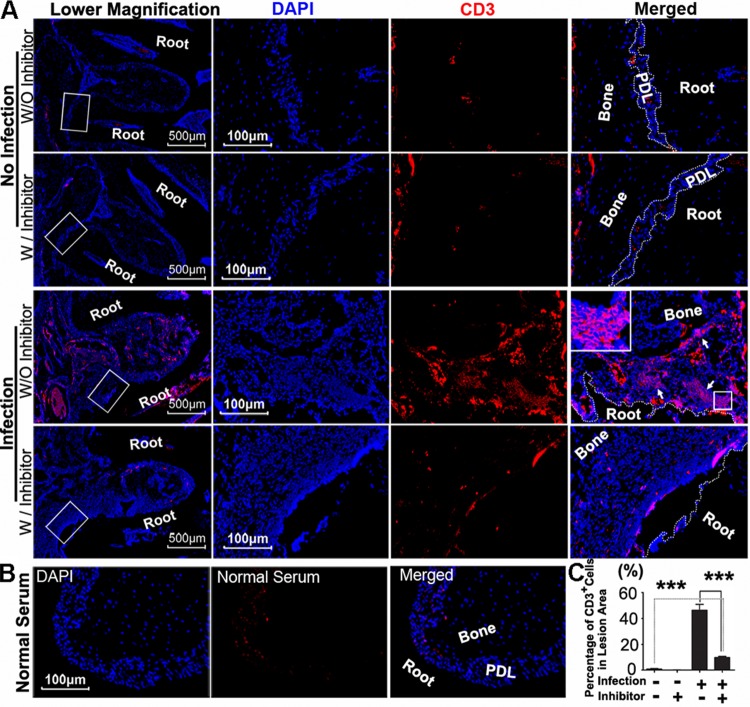
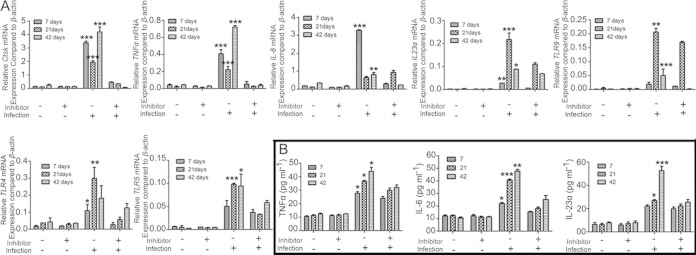
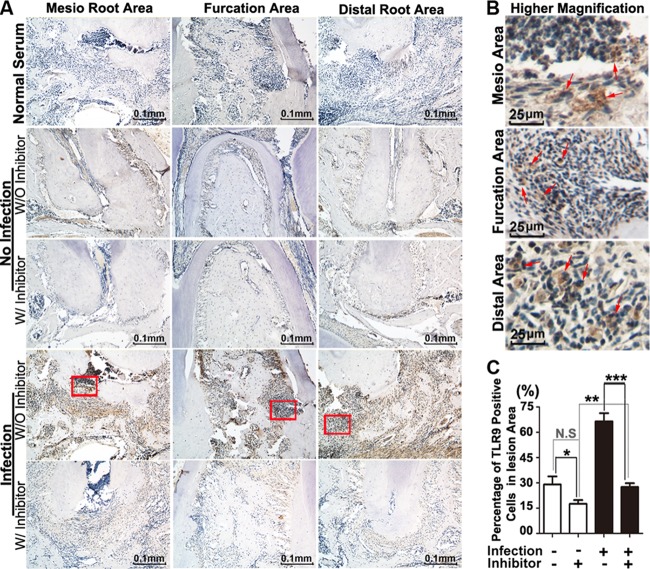
Periapical disease, an inflammatory disease mainly caused by dental caries, is one of the most prevalent infectious diseases of humans, affecting both children and adults. The infection travels through the root, leading to inflammation, bone destruction, and severe pain for the patient. Therefore, the development of a new class of anti-periapical disease therapies is necessary and critical for treatment and prevention. A small molecule, odanacatib (ODN), which is a cathepsin K (Ctsk) inhibitor, was investigated to determine its ability to treat this disease in a mouse model of periapical disease. While Ctsk was originally found in osteoclasts as an osteoclast-specific lysosomal protease, we were surprised to find that ODN can suppress the bacterium-induced immune response as well as bone destruction in the lesion area. X rays and microcomputed tomography (micro-CT) showed that ODN treatment had significant bone protection effects at different time points. Immunohistochemical and immunofluorescent staining show that ODN treatment dramatically decreased F4/80+ macrophages and CD3+ T cells in the lesion areas 42 days after infection. Consistent with these findings, quantitative real-time PCR (qRT-PCR) and enzyme-linked immunosorbent assay (ELISA) analysis showed low levels of proinflammatory mRNAs (for tumor necrosis factor alpha, interleukin 6, and interleukin 23α) and corresponding cytokine expression in the ODN-treated disease group. The levels of mRNA for Toll-like receptors 4, 5, and 9 also largely decreased in the ODN-treated disease group. Our results demonstrated that ODN can inhibit endodontic disease development, bone erosion, and immune response. These results indicate that application of this small molecule offers a new opportunity to design effective therapies that could prevent periapical inflammation and revolutionize current treatment options.


Figures

FIG 1
FIG 1
Inhibition of Ctsk by specific inhibitor reduced infection-stimulated endodontic bone resorption by micro-computed tomography (micro-CT) analysis. (A) X-ray and micro-CT analysis of endodontic lesion areas of the normal groups over the natural course of infection with and without inhibitor (3.606 mg/kg/week) at 42 days. (B to D) X-ray and micro-CT analysis of end odontic lesion areas of the bacterium-infected groups with and without inhibitor (3.606 mg/kg/week) at 7, 21, and 42 days. There was an obvious reduced bone density area compared to the inhibitor-treated disease group at different time points (arrows). The X-ray and micro-CT analysis showed increased low-bone-density areas in the furcation and periapical areas at 42 days compared with 7 days and 21 days. (E) Quantification of bone volume/tissue volume measured for periapical lesion areas in different groups. *, P < 0.05; **, P < 0.01; ***, P < 0.001. Each experiment was repeated three times (n = 3). N.S, no significance. The left columns of panels A to D are X-ray images, the middle columns are typical slice two-dimensional micro-CT images, and the right columns are three-dimensional reconstituted images.
FIG 2
FIG 2
Inhibition of Ctsk by specific inhibitor showed bone protection effects at different time points by histology analysis. (A) H&E staining of the periapical mesial and distal root sections and furcation area sections from the bacterium-infected groups with and without inhibitor (3.606 mg/kg/week) at 7, 21, and 42 days. Red arrows indicate the inflammatory monocyte infiltration. The dotted red outline indicates the remaining bone in the lesion area. (B) Quantification of remaining bone area in these three areas at 7, 21, and 42 days. (C) Time course analysis of the bone resorption in the bacterium-infected groups with and without inhibitor (3.606 mg/kg/week). *, P < 0.05; **, P < 0.01; ***, P < 0.001. N.S, no significance. Each experiment was repeated three times (n = 3).
FIG 3
FIG 3
Inhibition of Ctsk by the specific inhibitor showed reduced TRAP+ cells in periapical lesions at different time points by histology analysis. (A) TRAP staining of the periapical mesial and distal root sections and furcation area sections from the bacterium-infected group with and without inhibitor (3.606 mg/kg/week) at different time points (7, 21, and 42 days). (B) Quantification of TRAP+ cell numbers in these three areas at 7, 21, and 42 days. (C) Time course analysis of TRAP+ cell numbers in the bacterium-infected groups with and without inhibitor (3.606 mg/kg/week). The TRAP+ cell number increased in the bacterium-infected group without inhibitor at different time points, and the TRAP+ cell number in the infected group with inhibitor (3.606 mg/kg/week) was significantly lower than that in the infected group without inhibitor. *, P < 0.05; ***, P < 0.001. N.S, no significance. Each experiment was repeated three times (n = 3).
FIG 4
FIG 4
Inhibition of Ctsk by the specific inhibitor showed reduced F4/80+ cells in periapical lesions at 42 days by immunohistological analysis. (A) Immunohistochemistry stains of F4/80+ (brown) macrophages in periapical lesions in the normal group and the bacterium-infected group with and without inhibitor (3.606 mg/kg/week) at 42 days. Normal serum served as the negative control. (B) Higher-magnification view of the images from the infection disease group at 42 days. Red arrows indicate F4/80+ macrophages. (C) Quantification of F4/80+ macrophages in the alveolar area of the normal group and the bacterium-infected group with and without inhibitor (3.606 mg/kg/week) at 42 days. **, P < 0.01; ***, P < 0.001. Each experiment was repeated three times (n = 3).
FIG 5
FIG 5
Inhibition of Ctsk by the specific inhibitor decreased the number of T cells in periapical lesions at 42 days. (A) Immunofluorescence staining of CD3+ (red) T cells in periapical lesion area in the normal group and the bacterium-infected group with or without inhibitor (3.606 mg/kg/week) at 42 days. White arrows show visible CD3-positive T cells. (B) Normal serum served as a negative control in the same area (without primary antibody). (C) Quantification of CD3+ cells demonstrated that inhibition of Ctsk significantly reduced expression of CD3+ T cells in bacterium-infected group with inhibitor (3.606 mg/kg/week) at 42 days. ***, P < 0.001. Each experiment was repeated three times (n = 3).
FIG 6
FIG 6
Inhibition of Ctsk by the specific inhibitor reduced the expression of proinflammatory genes as well as TLR and cytokine genes in the periapical lesion at different time points. (A) qRT-PCR of osteoclast genes (i.e., Ctsk) and proinflammatory genes (i.e., TNF-α, IL-6, and IL-23α) as well as TLR genes (i.e., TLR4, -5, and -9) in the periapical lesion from the normal group and the bacterium-infected group with and without inhibitor (3.606 mg/kg/week) at 7, 21, and 42 days. β-actin was used as an endogenous control. (B) Expression of TNF-α, IL-6, and IL-23α in the periapical lesion at 7, 21, and 42 days detected by ELISA. Significance was compared between disease groups with and without inhibitor at different time points. *, P < 0.05; **, P < 0.01; ***, P < 0.001. Each experiment was repeated three times (n = 4).
FIG 7
FIG 7
Inhibition of Ctsk by the specific inhibitor shows reduced expression of TLR9 in periapical lesions at 42 days by immunohistological analysis. (A) Immunohistochemistry stains of TLR9+ (brown) cell areas in the normal group and the bacterium-infected group with and without inhibitor (3.606 mg/kg/week) at 42 days. Normal serum served as a negative control. (B) Higher-magnification view of the images from the infection disease group at 42 days. Red arrows indicate TLR9+ cells. (C) Quantification of TLR9+ cells in furcation, mesial, and distal periapical area of the normal group and the bacterium-infected group with and without inhibitor (3.606 mg/kg/week) at 42 days. *, P < 0.05; **, P < 0.01; ***, P < 0.001. N.S, no significance. Each experiment was repeated three times (n = 3).

References

    1. Wang QQ, Zhang CF, Chu CH, Zhu XF. 2012. Prevalence of Enterococcus faecalis in saliva and filled root canals of teeth associated with apical periodontitis. Int J Oral Sci 4:19–23. doi:10.1038/ijos.2012.17. - DOI - PMC - PubMed
    1. Stashenko P, Teles R, D'Souza R. 1998. Periapical inflammatory responses and their modulation. Crit Rev Oral Biol Med 9:498–521. doi:10.1177/10454411980090040701. - DOI - PubMed
    1. Jiang H, Chen W, Zhu G, Zhang L, Tucker B, Hao L, Feng S, Ci H, Ma J, Wang L, Stashenko P, Li YP. 2013. RNAi-mediated silencing of Atp6i and Atp6i haploinsufficiency prevents both bone loss and inflammation in a mouse model of periodontal disease. PLoS One 8:e58599. doi:10.1371/journal.pone.0058599. - DOI - PMC - PubMed
    1. Yang S, Hao L, McConnell M, Zhou X, Wang M, Zhang Y, Mountz JD, Reddy M, Eleazer PD, Li YP, Chen W. 2013. Inhibition of Rgs10 expression prevents immune cell infiltration in bacteria-induced inflammatory lesions and osteoclast-mediated bone destruction. Bone Res 1:267–281. doi:10.4248/BR201303005. - DOI - PMC - PubMed
    1. Eleazer PD, Farber PA, Seltzer S. 1975. Lack of lymphocyte stimulation by root canal products. J Endod 1:388–394. doi:10.1016/S0099-2399(75)80157-9. - DOI - PubMed

Publication types

MeSH terms

LinkOut - more resources